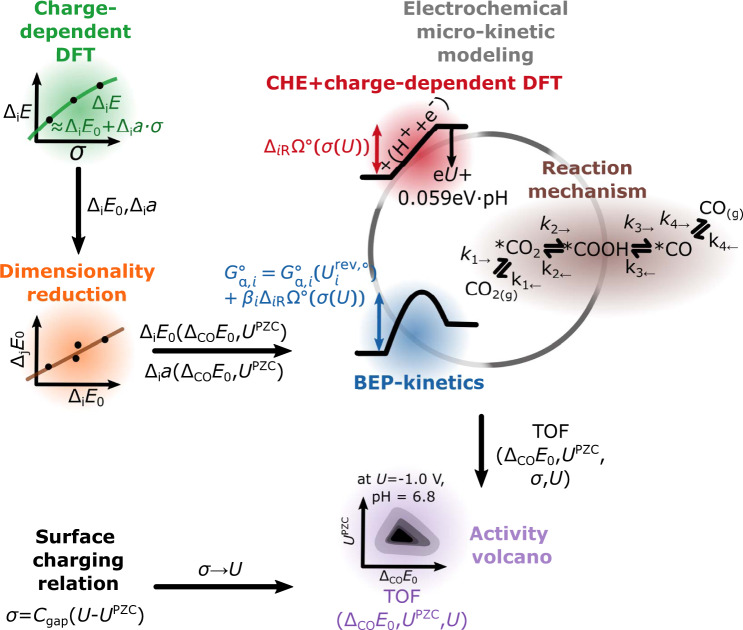
Fig. 1. Schematic illustration of the derivation of electrochemical activity volcanos.
DFT calculations provide adsorption energies on a chosen facet as a function of surface charge density which can be interpolated. As a result, adsorption energies are obtained at zero surface charge density and the charge sensitivity parameter, and the process is repeated for various facets to generate a database. Then, the data is used to search for correlations among the properties to reduce the dimensionality of descriptors needed to define all adsorption energies and charge sensitivity parameters and thus the full free energy diagram. After this, the determined descriptors CO adsorption energy and PZC are used to build up a two-dimensional TOF figure. For this, the micro-kinetic rate equations are solved on a grid of points on this two-dimensional figure where each point defines a descriptor pair that uniquely links to a full free energy diagram via the determined correlations. To get the potential- and pH dependence of the free energy diagram at a given point, the CHE model is used together with the surface charging relation which eliminates the surface charge density from the expression. Kinetics are described by Brønsted-Evans-Polanyi (BEP) scaling relations with empirically chosen parameters.

