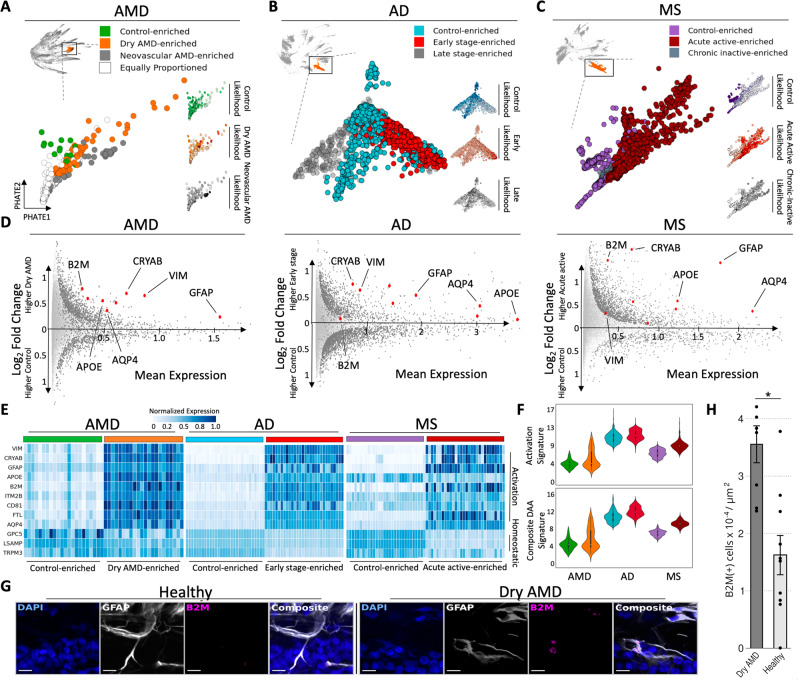
Fig. 4. Fine grain analysis of astrocytes reveals a shared activation signature enriched in the early phase of neurodegenerative diseases.
A 474 astrocytes identified by diffusion condensation at coarse granularity (upper left) can be further subdivided into three clusters at fine granularity, each enriched for cells from a different stage of neurodegenerative disease. Disease state enrichment was calculated using MELD (right) for each condition: Control (top), dry AMD (middle) and neovascular AMD (bottom), with higher MELD likelihoods shown with darker colors. A resolution of the condensation homology, which optimally isolated MELD-likelihood scores from each condition was identified using topological activity analysis. Astrocytes are revisualized using PHATE. B As in panel A, three subsets of 2361 astrocytes are found in AD with diffusion condensation and topological activity analysis, each enriched for cells from a different stage of AD disease as computed by MELD (right). Astrocytes are revisualized with PHATE. C As in panel A, three subsets of 5469 astrocytes are found in MS with diffusion condensation and topological activity analysis, each enriched for cells from a different stage of MS as computed by MELD (right). Astrocytes are revisualized with PHATE. D Differential expression analysis between control-enriched and early stage of neurodegenerative disease-enriched clusters across neurodegenerative diseases reveals a shared activation pattern in the early stage of disease. This signature includes B2M, CRYAB, VIM, GFAP, AQP4, APOE, ITM2B, CD81, FTL. Significant differentially expressed genes visualized in dark gray (two-sided EMD test with FDR corrected p-value < 0.1 as described in methods). E Heatmap demonstrating differences in astrocyte expression of the neurodegenerative shared activation pattern and a homeostatic signature between control-enriched and early or acute active disease-enriched astrocytes across neurodegenerative diseases. Color conventions are as in panels A–C. Rows correspond to genes and columns represent individual cells. We have plotted 40 cells from each dataset selected through random sampling to reveal the difference between control-like and early-disease-like cellular states. F Composite astrocyte activation signature (top) and disease-associated astrocyte signature (DAA) for the neurodegenerative shared activation pattern in control-enriched cluster and early-disease-enriched cluster across neurodegenerative diseases. Color conventions are as in panels A–C (y-axis—gene expression of signature). Details on statistics are available in methods section. G Micrographs of combined in situ RNA hybridization and GFAP immunofluorescence showing more abundant B2M expression in astrocyte-rich retinal layers from dry AMD retina when compared to control. All scale bars = 10 μm. H Bar plot showing density of B2M transcripts in the astrocyte-rich inner plexiform layer, retinal ganglion cell layer, and nerve fiber layers in retina samples affected by dry AMD (n = 8 cells) and control (n = 10 cells). Data are presented as mean values ± SEM; *p < 1e-03; Welch Two Sample t-test.

