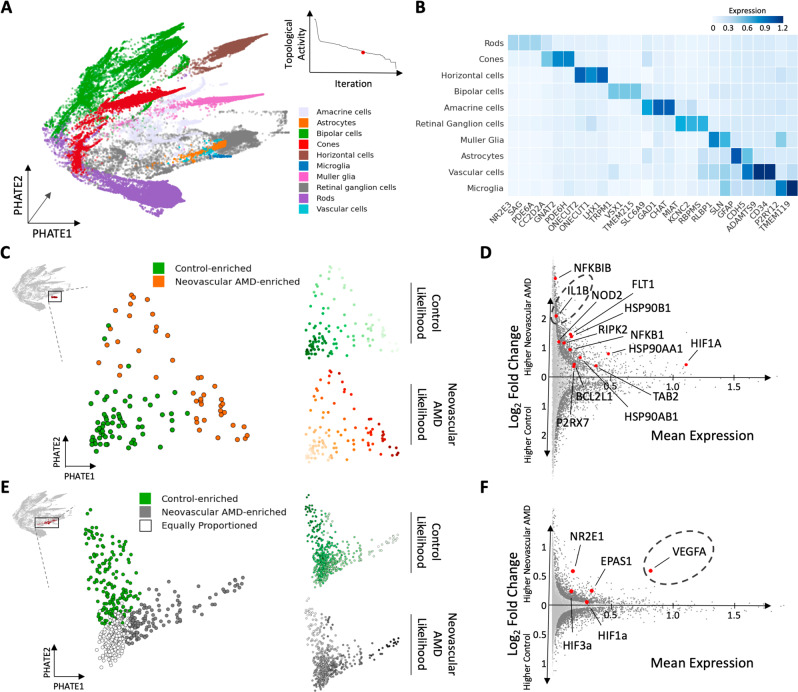
Fig. 5. Cell-type-specific changes in gene expression during AMD disease progression.
A PHATE visualization of 46,783 nuclei isolated from neovascular AMD and control retinas65. CATCH analysis identified a resolution of the condensation homology, which isolated cell types. As in Figure 3, each cellular cluster was assigned a cell-type identity based on which gene signature it expressed at the highest level. B CATCH-identified cell types, as shown by the average normalized expression of known cell-type-specific marker genes. C Disease state enrichment was calculated using MELD (right) for each condition: Control (top), and neovascular AMD (bottom), with higher MELD likelihoods shown with darker colors. A resolution of the condensation homology, which optimally isolated MELD-likelihood scores from each condition was identified using topological activity analysis. Microglia are revisualized using PHATE. Two subsets of microglial cells, one enriched for microglia from retinas with neovascular AMD and another from control retinas. D Differential expression analysis between control-enriched and neovascular disease-enriched microglial clusters revealed a different activation pattern in late disease. Significant differentially expressed genes visualized in dark gray (two-sided EMD test with FDR corrected p-value < 0.1 as described in methods). This signature includes NFKBIB, IL1B, NOD2, FLT1, HSP90B1, RIPK2, NFKB1, HSP90AA1, HIF1A, BCL2L1, P2RX7, TAB2, HSP90AB1. E Disease state enrichment was calculated using MELD (right) for each condition: Control (top) and neovascular AMD (bottom) with higher MELD likelihoods shown with darker colors. A resolution of the condensation homology, which optimally isolated MELD-likelihood scores from each condition was identified using topological activity analysis. Astrocytes are revisualized using PHATE. CATCH-identified three subsets of astrocyte cells, one enriched for astrocytes from neovascular retinas, another from control retinas and a third equally split between conditions. F Differential expression analysis between the control-enriched and neovascular disease-enriched astrocyte clusters reveals a different activation pattern in late-stage neovascular disease. Significant differentially expressed genes visualized in dark gray (two-sided EMD test with FDR corrected p-value < 0.1 as described in Methods section). This signature includes NR2E1, EPAS1, VEGFA, HIF1A, HIF3A.

