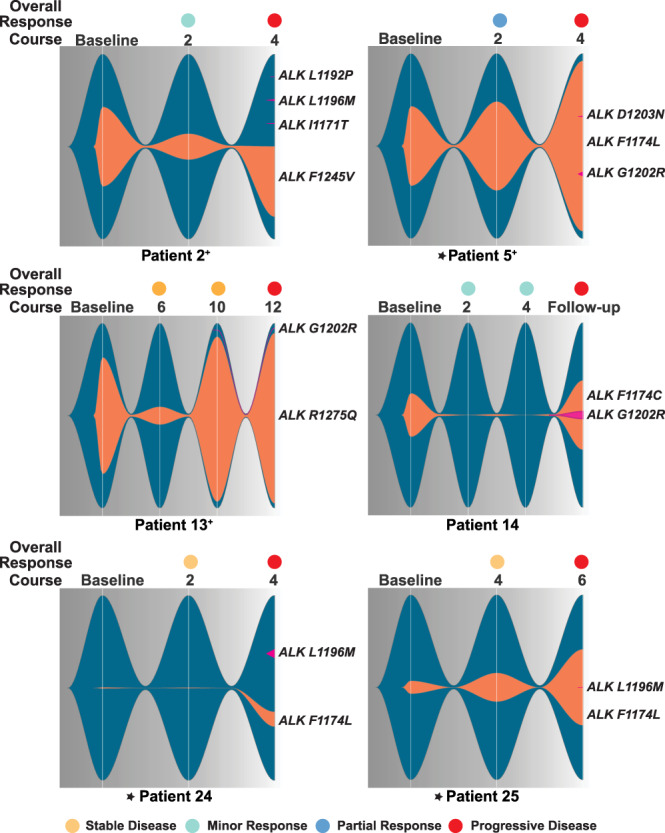
Fig. 4. Development of compound ALK mutations corresponds with tumor resistance and disease progression.

Fishplots demonstrate detectable ALK at each timepoint, with dark blue background and orange clones showing the original neuroblastoma ALK mutation and the size of the fish proportional to VAF (see Source Data). Secondary ALK mutations are colored magenta; when occurring in cis they are depicted within the orange clone and when in trans or unknown, they are depicted outside the clone. Asterisks indicate patients with MYCN amplification, and patient numbers are annotated with a ‘+’ sign if they had received prior ALK inhibitor therapy. Source data are provided as a Source Data file.
