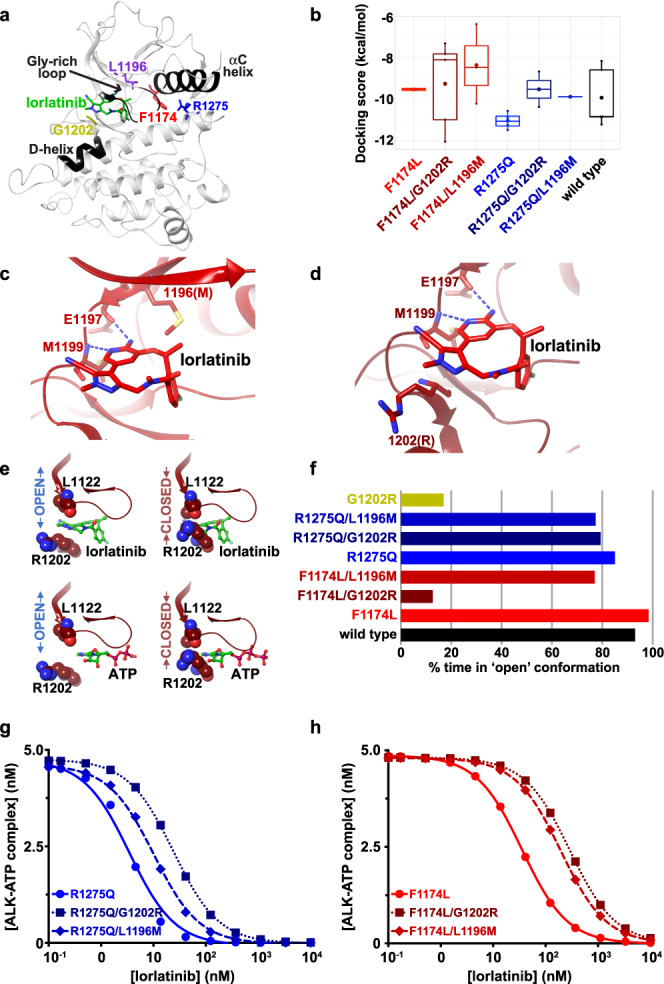
Fig. 6. Structural modeling of lorlatinib resistance due to compound mutations.

The color designations for ALK variants in this figure are as follows: F1174L (red) F1174L/G1202R (dark red), F1174L/L1196M (medium red), R1275Q (blue), R1275/G1202R (dark blue), R1275Q/L1196M (medium blue), L1196M (purple), and G1202R (gold). a Structure of wild-type ALK-TKD with bound lorlatinib (PDB ID: 4CLI15), highlighting the positions of key structural elements, a bound lorlatinib molecule (green), F1174 (red), R1275 (blue), L1196 (purple) and G1202 (gold). b Distribution of lorlatinib-docking scores for modeled ALK-TKD variants, with lower (more negative) docking scores corresponding to increased binding energy. The docking scores were generated with n of 10 independently run induced fit docking experiments. For each variant, the filled symbol in the boxplot represents the mean, the horizontal line within the box represents the median, and upper and lower bounds of the box represent the 75th and 25th percentiles (to give interquartile range). The upper and lower whiskers represent the maximum and minimum values of the data that are within 1.5 times the interquartile range. c Best-fit docked lorlatinib (medium red) pose in the F1174L/L1196M ALK-TKD variant (docking score −10.213 kcal/mol), with lorlatinib shown in red and conserved interactions (blue dashed lines) with E1197 and M1199 of the hinge region marked, as well as position 1196 (replaced with M). d Best-docked lorlatinib pose for F1174L/G1202R (docking score −12.033 kcal/mol) showing conserved interactions (blue dashed lines) with E1197 and M1199 of the hinge region and the arginine introduced at position 1202. e Positions of R1202 and L1122 in the F1174L/G1202R ALK-TKD model in both the gate-open (left) and gate-closed (right) conformations, showing that ATP (green) placed as in PDB ID 3BU555 (bottom) can bind either conformation, whereas lorlatinib placed as in PDB ID: 4CLI15 (top) can only bind the gate-open conformation. f Plot of the percentage of time in the 300 ns MD simulations that each ALK-TKD variant noted spends in the gate-open conformation. Note that the F1174L/G1202R variant spends 10% of the time with the gate ʻopenʼ, and ~90% with the gate closed. g Lorlatinib inhibition curves generated in silico for R1275Q-based variants as described in Methods and Supplementary Note 2, with [ALK-TKD] set at 5 nM, and [ATP] at 1 mM, using only the gate-open kinetic model. h Lorlatinib inhibition curves generated in silico for F1174L-based variants as described in h. Curves for ALK-TKD with the F1174L (red circles, solid curve) or F1174L/L1196M (medium red diamonds, dashed curve) mutation were unaffected by whether or not the gate was allowed to close (see Supplementary Data Fig. 8e). Only with the gate closed ~90% of the time as predicted in f see Supplementary Data Fig. 8a, b) did the F1174L/G1202R variant (dark red squares, dotted curve) show the increased IC50 value plotted here. Source data are provided as a Source Data file.
