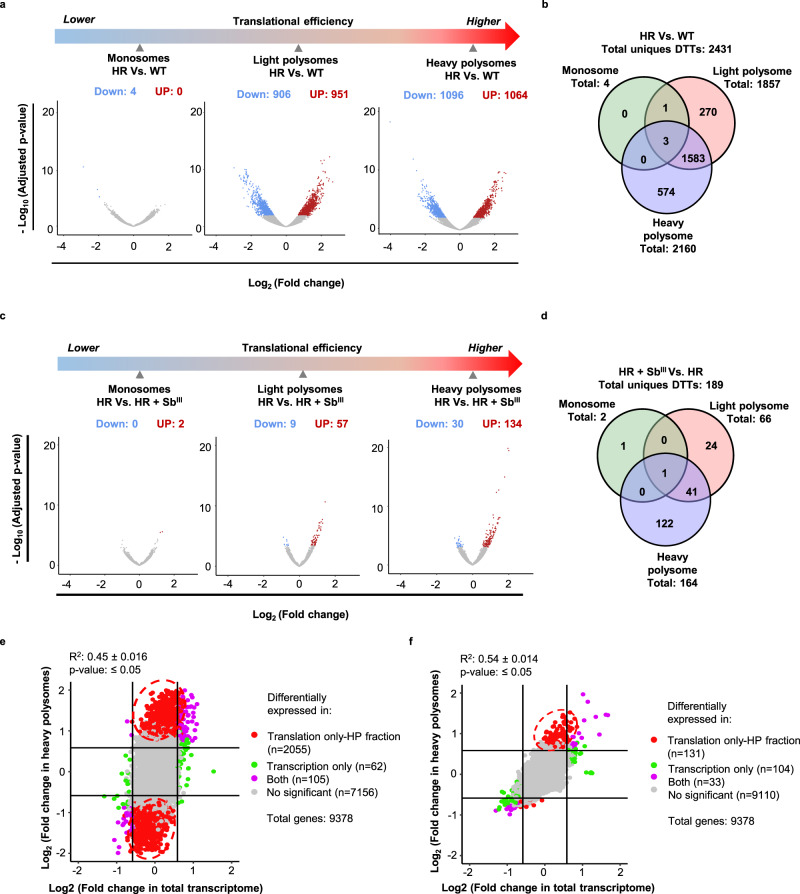
Fig. 3. SbIII-resistant parasites exhibit dramatic translational reprogramming.
Resistant parasites show differential translatome remodeling in the absence/presence of the drug and most of the changes are detected in the translatome instead of the total transcriptome. a Volcano plots showing that antimony-resistant parasites growing without drug pressure have a dramatic translatome remodeling. b Venn diagram showing DTTs distributed per ribosome fractions in resistant parasites in comparison to sensitive in the absence of drug challenge (basal changes). c Volcano plots demonstrating significant changes in translational efficiency for certain transcripts in the presence of drug challenge (HR + SbIII Vs HR). d Venn diagram showing DTTs distributed per polysome fractions after drug challenge. e Comparison of the translatome Vs. transcriptome at the basal level. n: three biologically independent replicates. Two-sided pearson correlation. t distribution score: 48.659, degree of freedom: 9246, P value <2.2 × 10⁻¹⁶, R2: 0.451, 95% IC (0.435, 0.467). f Comparison of the translatome Vs. transcriptome under the drug challenge. n: three biologically independent replicates. Two-sided pearson correlation. t distribution score: 61.974, degree of freedom: 9253, P value <2.2 × 10⁻¹⁶, R2: 0.541, 95% IC (0.527, 0.555). a, c The Y axes represent the adjusted P values estimated by Benjamini and Hochberg method and transformed by the negative logarithm base 10 or - Log10 (Adjusted P value), higher values correspond to smaller P values or more reliable. logarithm base twofold change or Log2 (Fold change). Negative and positive values correspond to the downregulated and upregulated genes, respectively. Significant decrease (down). Significant increase (up). e, f Genes that were detected as differentially expressed only in heavy polysomes (translation only). Genes that were detected as differentially expressed only in the total transcriptome (transcription only). Genes that were detected as differentially expressed in both total transcriptome and heavy polysomes (“both”). Genes that were not considered as differentially expressed (no significant). The raw data of (a–f) are available in Source Data.

