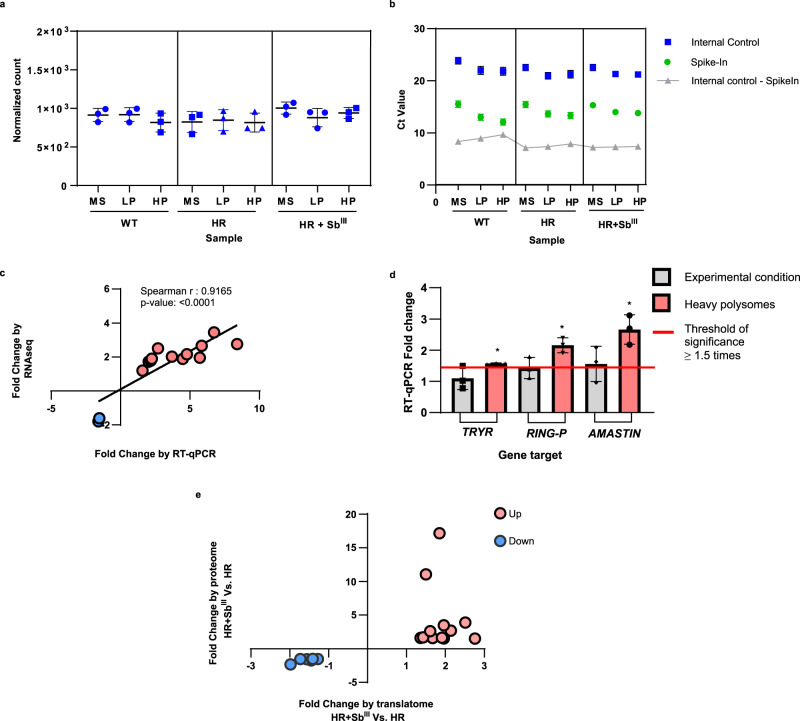
Fig. 4. Validation of translatome data by RT-qPCR and proteome analyses.
a Internal housekeeping gene (LmjF.35.1945) for RT-qPCR validation showing similar expression levels in all samples. The normalized read count across all samples was compared using a one-way ANOVA analysis. n: 27 observations. Degrees of freedom for the numerator: 11. Degrees of freedom for the denominator: 24. F distribution value: 1.594. P value: 0.1639. Monosomes (MS), light polysomes (LP), and heavy polysomes (HP). n: 3 biologically independent replicates. Data are presented as mean values +/– SD. b Comparison of the internal control (IC, blue dots) and OMPA RNA used as Spike-In (green dots) showing a similar tendency in the distribution of Ct values across the experimental conditions; n: two independent biological replicates with three technical replicates. c Spearman analysis showing a significant positive linear correlation between the fold changes (not log-transformed) estimated by translatome analysis or RNA-Seq (Y axis) and RT-qPCR analysis (X axis). n: three independent biological replicates with three technical replicates. Two-tailed Spearman correlation. rho: 0.9165, 95% CI: 0.7435 to 0.9745, alpha: 0.05, P value: 1.37 × 10⁻⁵. The validation by RT-qPCR only included the heavy polysome fraction of resistant parasites growing under the SbIII challenge. n: 3 independent biological replicates with three technical replicates. d Comparison of the fold changes detected by RT-qPCR (Y axis) using two different types of samples, total RNA input (gray bar) and heavy polysome fraction (red bar). In both cases, the parasites were grown under SbIII challenge. Unchanged genes at the total RNA level were detected as significantly differentially translated in heavy polysomes. Threshold of significant fold change ≥1.5 (red line). Effect sizes over the cutoff of 1.5 (asterisk mark). Not significant DEG (gray bar). e The linear fold changes were compared between proteomic and translatomic analyses (HR + SbIII Vs HR). Protein/transcripts consistently upregulated (red dots). Protein/transcripts consistently downregulated (blue dots). A total of 20 proteins were matched with respective transcripts and these are described in Supplementary Data 10. The raw data of (a–e) are available in Source Data.

