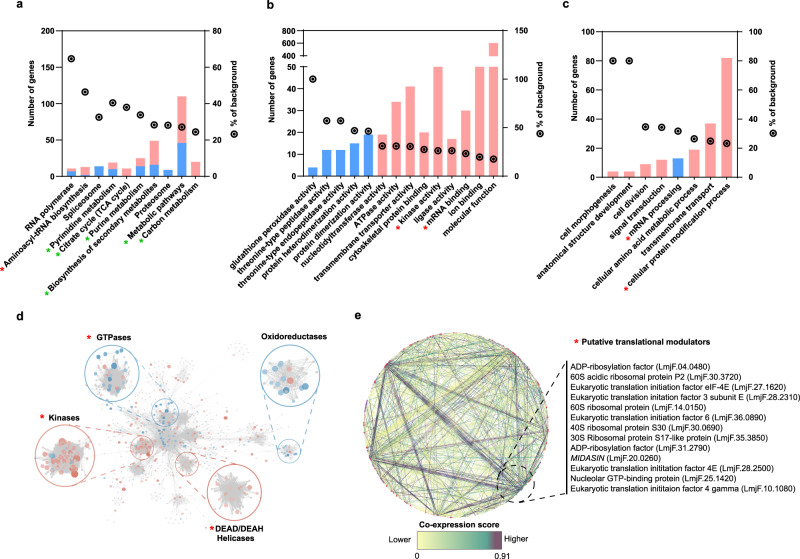
Fig. 6. Global translatome analysis of resistant parasites growing without drug challenge reveals complex preemptive adaptations to facilitate drug resistance.
Gene ontology (GO) and metabolic enrichment analysis were performed using the TriTrypDB browser. The number of genes per category is shown on the left of the Y axis. The right Y axis represents the percentage of the total background per category as a parameter of enrichment shown as a circle with a dot. a Enriched metabolic pathways. b Enriched molecular function GO categories. c Enriched biological process GO categories. a–c GO categories significantly enriched were filtered by FDR ≤ 0.05 using Benjamini–Hochberg method. Upregulated DTTs (pink), downregulated DTTs (blue). d Protein–protein interaction network based on connectivity and betweenness centrality by protein structure, experimental evidence, and protein family, highlighting four enriched clusters. e STRING protein–protein interaction network based on known protein co-expression or putative homologs co-expressed in other organisms. A core of translational modulators can potentially regulate the expression of several components of the network based on the number of interactions and co-expression scores. Co-expression scores are shown on a scale of 0 (yellow) to 1 (dark purple), where 1 is the higher co-expression level between two proteins. Proteins potentially associated with translational control are shown on the right side. The raw data of (a–e) are available in Source Data.

