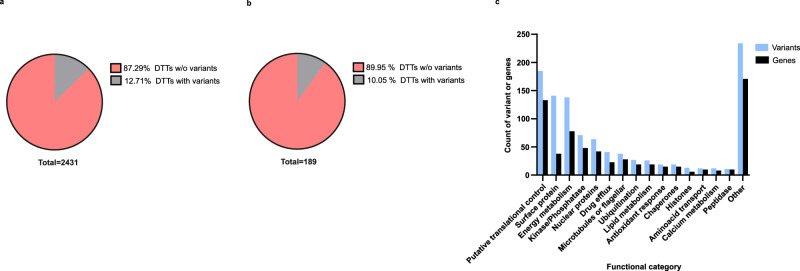
Fig. 8. Only a minor group of DTTs showed associated variants but the functional categories involved are consistent between DTA and VCA.
The gene variants exclusively detected in SbIII-resistant parasites were matched with differential translational analysis and distributed per gene functional categories. a Pie plot summarizing the percentage of DTTs detected at the basal level with associated gene variants. b Pie plot summarizing the percentage of DTTs detected after drug challenge with associated gene variants. c Bar plot summarizing the number of variants (blue bars) and associated genes (black bars) per functional category. Functional categories were manually annotated based on the gene function. Only functional categories covering at least ten variants or genes were included. Variants associated with genes with unknown functions were not considered. The raw data of (a, b) are available in Source Data.

