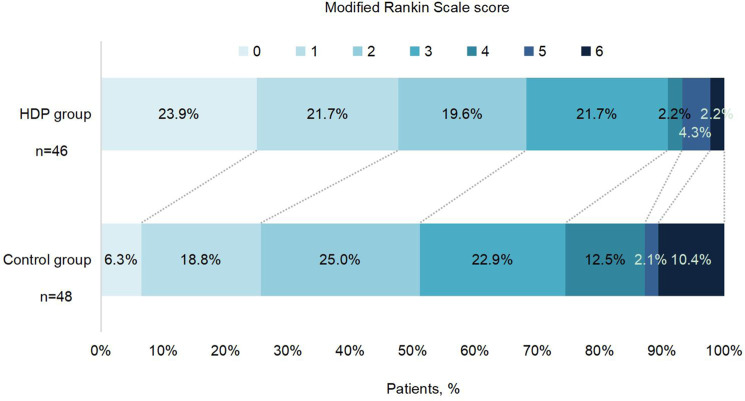
Fig. 2. Distribution of modified Rankin scale scores at 90 days by treatment groups in the modified intention-to-treat population.
Raw distribution of scores is shown. Scores range from 0 to 6: 0 = no symptoms, 1 = symptoms without clinically significant disability, 2 = slight disability, 3 = moderate disability, 4 = moderately severe disability, 5 = severe disability, and 6 = death. HDP head-down position. Source data are provided as a Source Data file.

