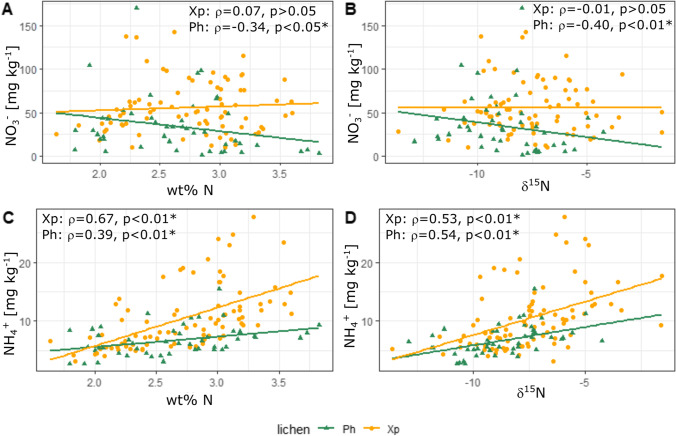
Fig. 7.
Scatterplots of nitrate (A and B) and ammonium (C and D) concentrations for comparison with (A and C) nitrogen contents [wt%] and (B and D) δ15N [‰] in X. parietina (Xp) and Physcia spp. (Ph; analytical precision, lichen CRM BCR-482-derived for N wt% ± 0.04; δ15N ± 0.23; NO3− ± 0.45 and NH4.+ ± 0.25: not shown in figure); displayed with correlation statistics (Spearman ρ, statistically significant correlation marked with *)

