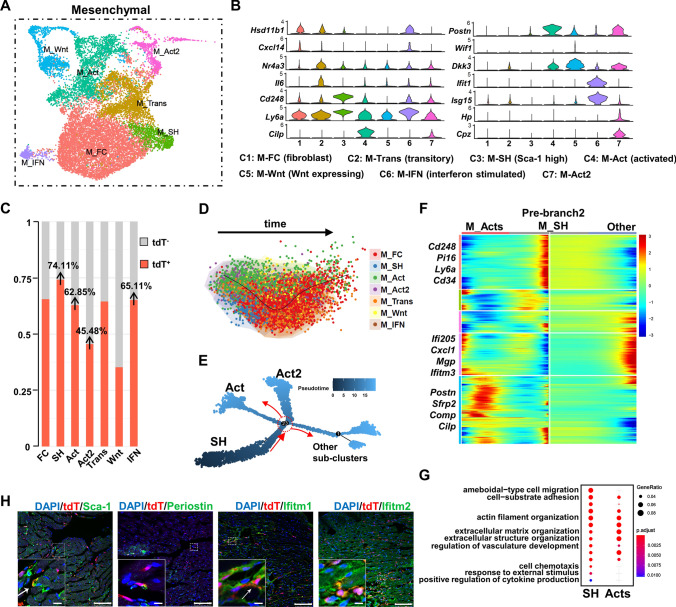
Fig. 3.
Contribution of Cd34-lineage mesenchymal cells in I/R injury. A UMAP plot showing 7 color-coded subclusters from the mesenchymal (Mesen) cell population in I/R injury, n = 14,125 cells. B Total-cell and tdTomato+ (tdT+) cell datasets from all time points (sham, I/R 1w, I/R 2w) were integrated, mesenchymal cell population were subclustered for deep investigation. Violin plot showing expression of selected marker genes across all mesenchymal cell subclusters, with putative cell identities annotated below. C Proportion of tdT+ cells in each mesenchymal cell subcluster. D, E SCORPIUS (D) and Monocle (E) trajectory analyses showing the relationship among tdTomato+ mesenchymal cell subclusters and potential differentiation directions over pseudotime. The branch point 2 selected for downstream analyses is indicated by the red circle. F Heatmap of the significantly changed genes (P < 0.01) discovered by the BEAM function from monocle in the branch point 2 in (E), with selected upregulated genes listed at different cell states (prebranch, cell fate 1 and 2). G GOBP analysis of significantly changed genes (P < 0.01) in different cell fates discovered by the BEAM function from Monocle in the first branch point (branch point 2) from the trajectory in (E). H Representative images of Cre/TDT ventricles staining tdT with Sca-1, Periostin, Ifitm1 and Ifitm2 in border zones, with magnification of the boxed region, arrows indicated co-staining cells. Scale bars, 100 μm, and 20 μm in magnification. IFN, interferon stimulated. Mesen, mesenchymal cell. tdT tdTomato

