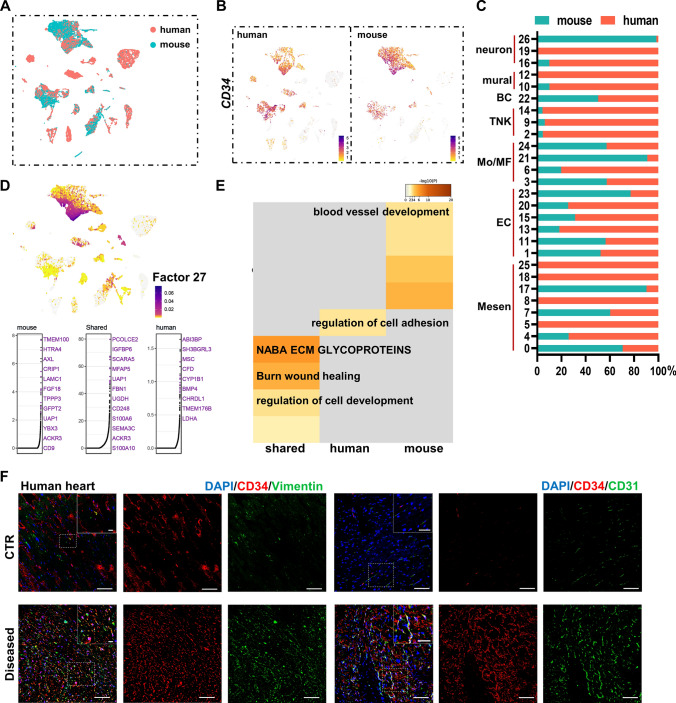
Fig. 8.
Validation of CD34+ cells in human heart. A UMAP visualization of human and mouse single cells analyzed by LIGER, color coded by species. B Feature plots exhibiting the expression of CD34 across species. C Proportion of human and mouse cells in each single-cell cluster in the integrated dataset. D Cell factor loading values (upper) and gene loading plots (below) of left loading species-specific and shared genes for factor 27. E GOBP analysis of loaded genes in (D) indicating certain biological functions. F Representative images of CD34, co-staining with mesenchymal cell marker vimentin and endothelial cell marker CD31, in control and ischemic human hearts, with magnification of the boxed region. Scale bars: 100 μm, and 20 μm in magnification images. BC B cell, TNK T and natural killer (NK) cells, Mo monocyte, MF macrophage, EC endothelial cell, Mesen mesenchymal cell

