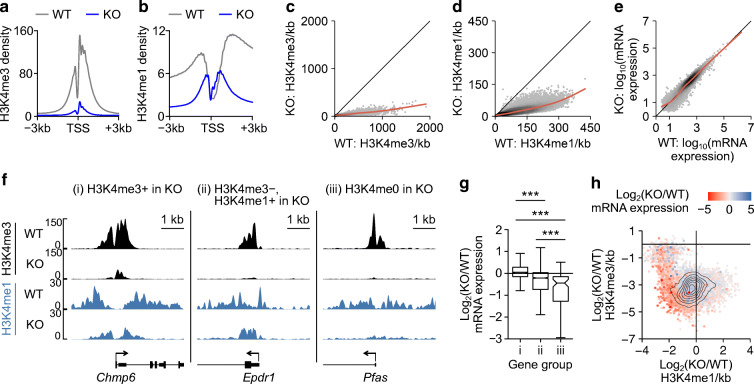
Fig. 3.
Transcription start site (TSS)-associated H3K4 methylation maintains gene expression in mature beta cells. (a, b) Average enrichment profiles of H3K4me3 (a) and H3K4me1 (b) at the TSS of all expressed genes in Dpy30-WT and Dpy30-KO chromatin. (c, d) Scatterplot of H3K4me3 (c) and H3K4me1 (d) enrichment in 10 kb bins spanning the genome in Dpy30-KO vs Dpy30-WT cells. (e) Scatterplot showing gene expression in Dpy30-KO vs Dpy30-WT cells. (f) Examples of genes that retain H3K4me3 (i), lose H3K4me3 but retain H3K4me1 (ii) and lose H3K4me3 and H3K4me1 (iii) from the TSS in Dpy30-KO chromatin. (g) Box and whisker plot showing log2(fold change) in RNA expression for gene groups exemplified in (f) (group i, n=10,045 genes, group ii, n=2302 genes, group iii, n=111 genes). (h) Contour scatterplot showing log2(fold change) in H3K4me1 enrichment (x axis) plotted against log2(fold change) in H3K4me3 enrichment (y axis) in the TSS±1 kb of all expressed genes. The log2(fold change) in RNA expression of the associated genes is shown as a colour gradient. ***p<0.001

