Fig. 6.
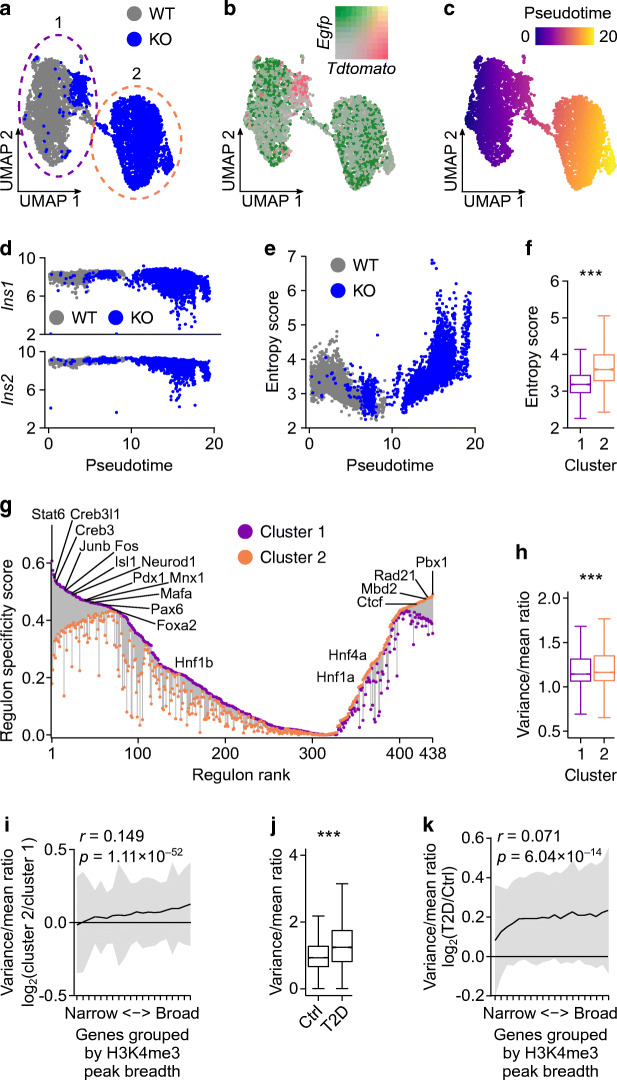
Reduction in transcriptional consistency in beta cells from Dpy30-KO mice and human donors with type 2 diabetes. (a–c) Uniform manifold approximation and projection (UMAP) visualisation of beta cell transcriptomes coloured according to genotype of the donor mouse (a), expression of tdTomato, EGFP and their overlap (b) and pseudotime (c). (d) Scatterplot showing Ins1 and Ins2 expression in beta cells plotted against pseudotime. (e) Scatterplot showing gene expression entropy scores of beta cells plotted against pseudotime. (f) Box and whisker plot showing transcriptome entropy of beta cells in clusters 1 and 2 (2466 and 2411 cells, respectively). (g) Active transcription factor regulons identified using SCENIC [67, 68], showing the specificity score of each regulon for cluster 1 (purple) and cluster 2 (orange) connected by a line. Regulons are ranked from the most specific for cluster 1 on the left to the most specific for cluster 2 on the right, and some notable regulons are labelled. (h) Box and whisker plot showing the variance/mean ratio of gene expression across beta cells in clusters 1 and 2. (i) Variance/mean ratio of beta cell gene expression in cluster 2 vs cluster 1 (y axis) plotted as a function of H3K4me3 breadth in quantiles (x axis) (622 genes/quantile). Data are presented as means ± SD. The Spearman rank correlation is shown. (j, k) The same analysis as in (h) and (i), respectively, in beta cells from human donors with or without type 2 diabetes, using H3K4me3 ChIP-seq data from Bramswig et al [52] and single-cell RNA-seq (scRNA-seq) data from Camunas-Soler et al [54]. P values were calculated using Wilcoxon rank-sum tests. ***p<0.001

