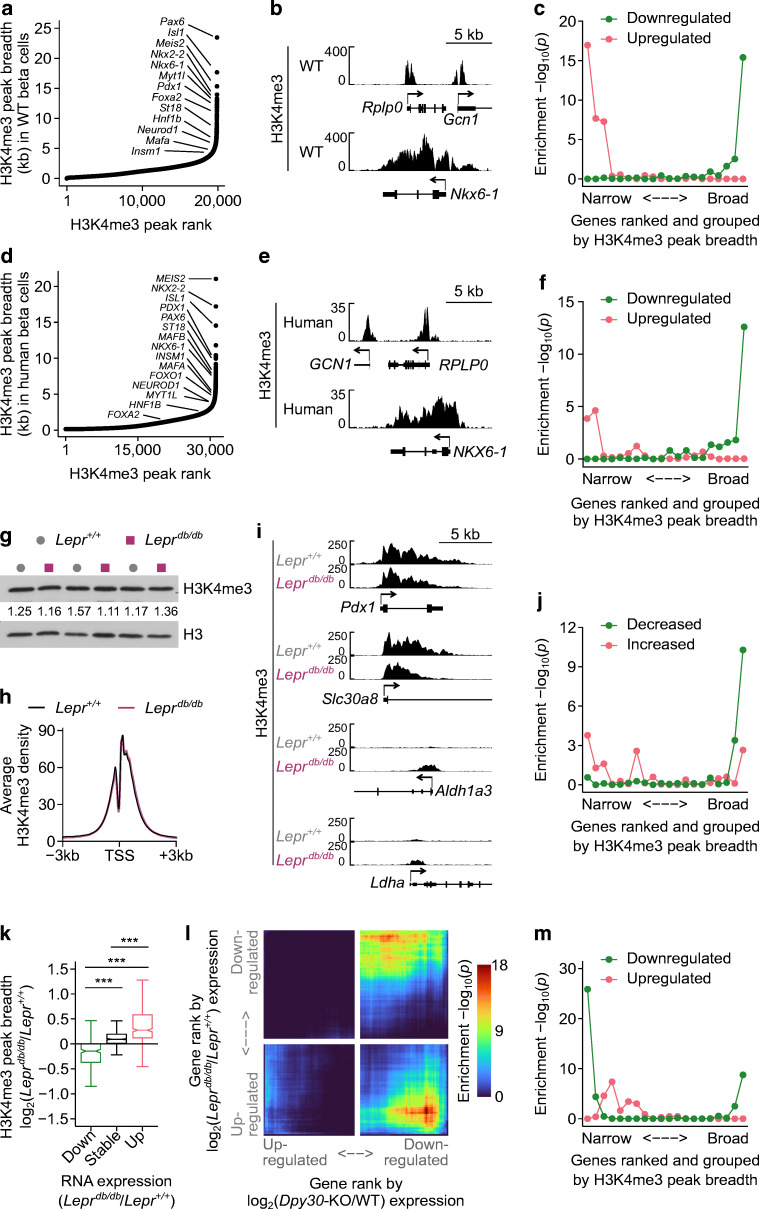
Fig. 7.
H3K4me3 peak breadth encodes gene expression changes in a mouse model of type 2 diabetes. (a) H3K4me3 peaks in Dpy30-WT beta cells ranked from narrow to broad. Peaks associated with beta cell transcription factor genes are labelled. (b) Genome browser views showing H3K4me3 at a housekeeping gene (Rplp0) and an expression-matched beta cell transcription factor gene (Nkx6-1). (c) Enrichment p values of genes down- or upregulated in islets from Leprdb/db mice, with genes ranked by H3K4me3 peak breadth (as in [a]) and grouped into 20 quantiles. P values were calculated using one-sided Fisher’s exact tests. (d, e) The same data as in (a, b) for human beta cells. (f) Enrichment p values of genes down- or upregulated in islets from donors with type 2 diabetes, with genes ranked by H3K4me3 peak breadth (as in [d]) and grouped into 20 quantiles. P values were calculated using one-sided Fisher’s exact tests. (g) Immunoblots of H3K4me3 and H3 in islet lysates from Lepr+/+ and Leprdb/db mice. H3-normalised H3K4me3 band densities are listed. (h) Average enrichment profiles of H3K4me3 at the TSS of all expressed genes in Lepr+/+ and Leprdb/db islets. (i) Genome browser views of H3K4me3 in Lepr+/+ and Leprdb/db islets at notable genes that are downregulated (Pdx1, Slc30a8) or induced (Aldh1a3, Ldha) in Leprdb/db islets. (j) Enrichment p values of H3K4me3 peaks showing significant change in peak breadth in Leprdb/db vs Lepr+/+ islets (y axis) in the different gene groups ranked from narrow to broad (x axis). Enrichment p values were calculated using one-sided Fisher’s exact tests. (k) Box and whisker plot showing the log2(fold change) in H3K4me3 peak breadth for genes that are downregulated, stably expressed and upregulated in Leprdb/db islets. P values were calculated using Wilcoxon rank-sum tests with Benjamini–Hochberg correction. ***p<0.001. (l) Stratified rank/rank hypergeometric overlap plot comparing gene expression changes caused by Dpy30-KO (x axis) and by Leprdb/db (y axis) mutations. Colourscale shows the hypergeometric enrichment p value. (m) Same as (c) for genes down- or upregulated in Dpy30-KO cells

