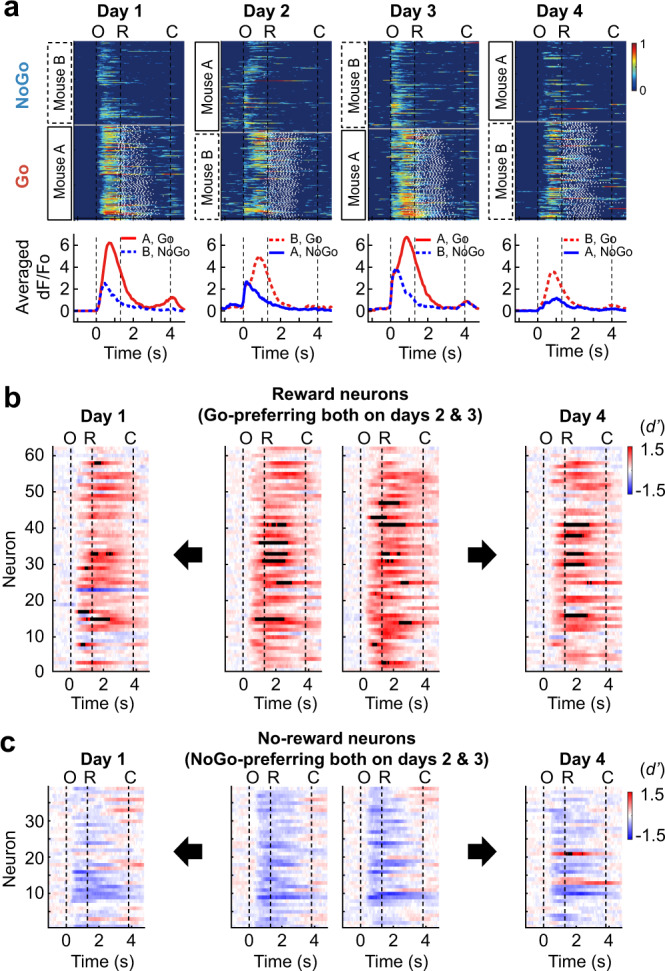
Fig. 4. Neural representation of reward expectancy is stable over days.

a Normalized calcium responses in each trial (top) and mean calcium responses (bottom) of an example neuron that maintained Go-preference during four consecutive sessions in which reward contingency was reversed daily (811 neurons from three mice; see Supplementary Fig. 4 for the sessions included). Red and blue colors for Go and NoGo trials, respectively. Solid and dashed lines for stimulus mouse A and B, respectively. O, window opening. R, start of response window. C, window closing. b Temporal changes in point-wise d’ value of the reward-selective neurons identified from the pair of sessions on days 2 and 3 (middle). Point-wise d’ values of the reward-selective neurons on days 1 (left) and 4 (right). c Temporal changes in point-wise d’ value of the no-reward-selective neurons identified from the pair of sessions on days 2 and 3 (middle). Point-wise d’ values of the no-reward-selective neurons on days 1 (left) and 4 (right). Source data are provided as a Source Data file.
