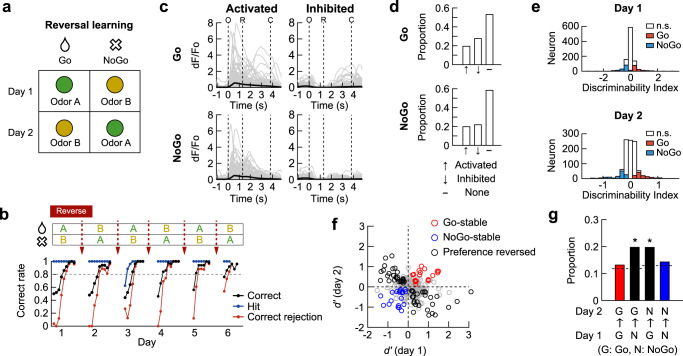
Fig. 5. Reward expectation neurons are not present in CA1 during non-social odor discrimination.
a Schematic of stimulus-reward contingency for a reversed session pair. b Learning curves of an example mouse that went through repeated reversal learning. Each filled circle represents the mean performance for fifty trials. c Mean responses of activated and inhibited neurons. Thin gray lines for individual neurons. Thick black lines for mean across the neurons. d Proportions of activated, inhibited or non-responsive neurons in O-R period (two-sided Wilcoxon signed-rank test, p < 0.05). e Distribution of d’ and significant d’ values (colored bars, shuffling test, two-sided, p < 0.05). The neuron with a significant d’ value was considered as a Go- or NoGo-preferring neuron. f Reward- (red) and no-reward-selective (blue) neurons that maintained Go- and NoGo-preference, respectively. Circles indicate individual neurons. Black circles indicate the neurons changed their preference. g The proportions of reward- (red) and no-reward-selective (blue) neurons as well as odor-selective neurons are no greater than chance (chi-square test, p = 3.4 × 10⁻⁴, post-hoc test on adjusted residuals, p = 6.2 × 10⁻⁴ for N → G, p = 5.3 × 10⁻³ for G → N). The broken lines indicate the chance to be Go- or NoGo-preferring on day 2. The chance levels equal to the proportions of Go- and NoGo-preferring neurons on day 2 in e. Source data are provided as a Source Data file.

