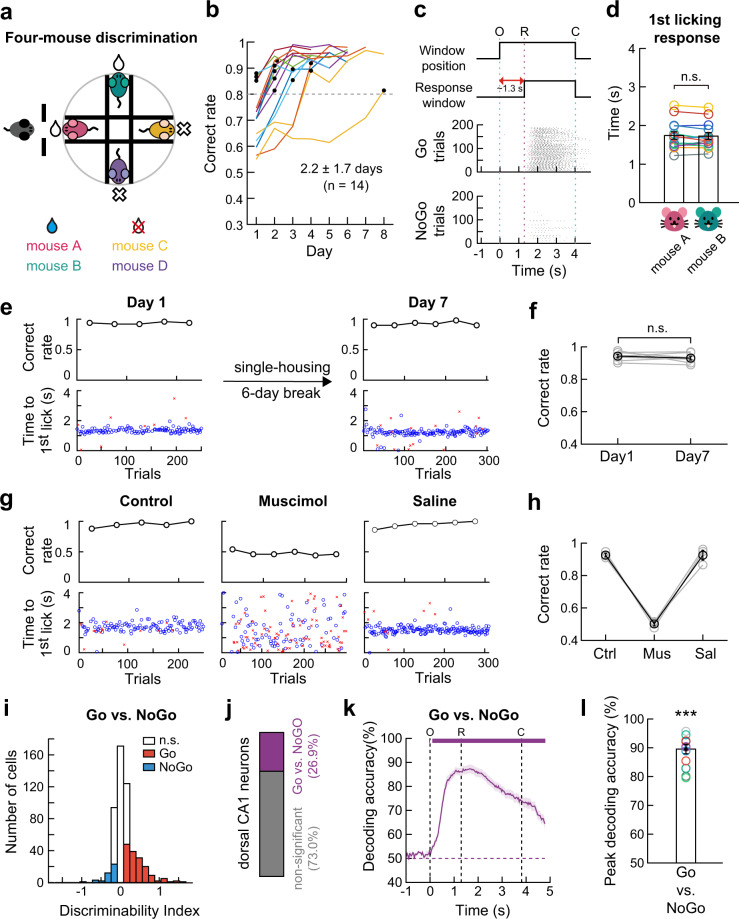
Fig. 6. Hippocampal activities in four-mouse discrimination task.
a Schematic of four-mouse discrimination task. b Training time course (n = 14 mice). The dashed line indicates the expert criterion. Black circles indicate the first session above the criterion. c Task structure (top). Raster plots of licking responses of a well-trained mouse in reward. The 1st licking responses to the four stimulus mice were marked with different colors; pink and green for reward-associated mice, yellow and purple for no-reward-associated mice. O, window opening. R, start of response window. C, window closing. d The 1st licking responses to each reward-associated mouse were not different (mean ± SEM, two-sided Wilcoxon signed-rank test, p = 0.76). Different colors for each subject mouse (n = 14). n.s., not significant. e Long-lasting memories of individual mice. Task performance (black circles). Blue circles and red crosses for correct and incorrect licks. f Group comparison (two-sided Wilcoxon signed-rank test, p = 0.54, n = 7 mice). Error bars, SEM across mice. g Muscimol, but not saline injection decreased the behavioral performance and dispersed the response time. h Group comparison of task performance. Ctrl, no injection; Mus, muscimol; Sal, saline. No statistical test made (n = 4 mice). Error bars, SEM across mice. i Histogram of d’ calculated within the O-R period for each neuron imaged in an expert mouse. Neurons showing significant d’ values (shuffling test, two-sided, p < 0.05) are color-coded (red, Go-selective; blue, NoGo-selective). j Proportion of neurons discriminating between Go and NoGo trials (n = 13 mice). k Hippocampal population activity accurately predicted trial types (Go versus NoGo) during the four-mouse discrimination task. The purple trace shows mean (±SEM, shaded area) decoding accuracy across 13 mice. Upper bars indicate the period of significant decoding (Cluster-based permutation test, p < 0.05). O, window opening. R, start of response window. C, window closing. l The peak decoding accuracy was higher than chance (mean ± SEM, two-sided Wilcoxon signed-rank test, p = 4.2 × 10⁻⁶). Circles for each mouse. Source data are provided as a Source Data file.

