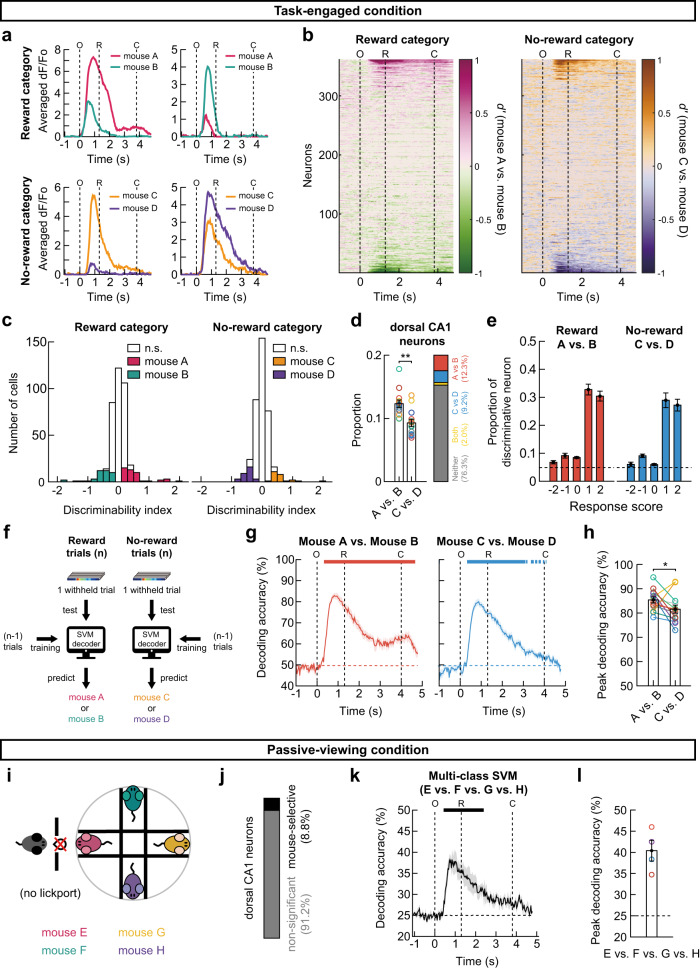
Fig. 7. Activity of dorsal CA1 neurons discriminates individual mice.
a Mean calcium responses of example neurons preferentially responding to each individual stimulus mice. Pink and green colors for reward-associated mouse A and B trials. Yellow and purple colors for no-reward-associated mouse C and D. O, window opening. R, start of response window. C, window closing. b Temporal profiles of d’ for all neurons in an example subject mouse. c Distribution of d’ for the reward-associated (left) and no-reward-associated mice (right), calculated within the O-C period for all neurons in an example subject mouse. Neurons with a significant d’ value are color-coded (shuffling test, two-sided, p < 0.05). d The proportion of mouse identity-selective neurons was higher in reward than no-reward category (mean ± SEM, two-sided Wilcoxon signed-rank test, p = 0.0018, n = 13 mice). e Proportion of mouse identity-selective neurons among the neurons with each response score in reward (left) and no-reward (right) category (mean ± SEM, n = 13 mice). Dashed lines indicate the chance level. f Application of support vector machine (SVM) to decode mouse identity-selective information. g SVM decoding accuracies of the identity of stimulus mice in the reward (left) and no-reward category (right). The data are presented as mean ± SEM (shaded area) across 13 expert mice. The upper bars represent the period of significant decoding (Cluster-based permutation test, two-sided, p < 0.05). h The peak decoding accuracies of individual mice were higher in reward than no-reward categories (mean ± SEM, two-sided Wilcoxon signed-rank test, p = 0.046, n = 13 mice). i Schematic of passive presentation experiments where a novel pair of four conspecifics was presented. j Mean proportion of neurons with a significant d’ (shuffling test with Bonferroni correction, two-sided, p < 0.05) obtained from each subject mouse (3–4 sessions) and averaged across four mice. k Multiclass SVM decoding accuracies of the stimulus mice in the passive condition (mean ± SEM (shaded area), n = 4 mice). l Peak decoding accuracies (mean ± SEM). No statistical test made (n = 4 mice). Source data are provided as a Source Data file.

