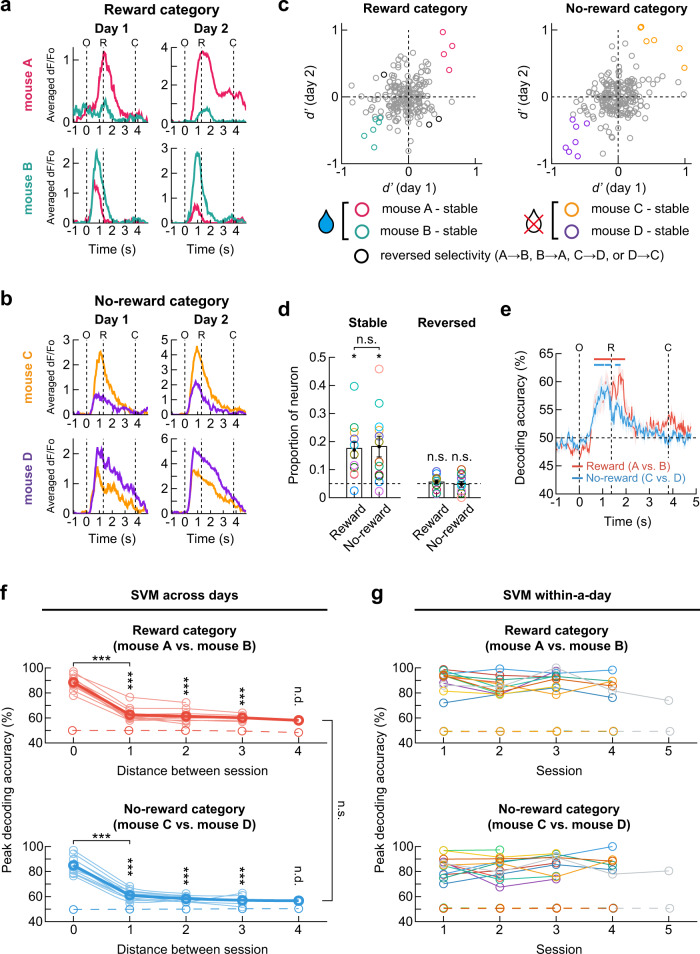
Fig. 8. Dynamics of the neural encoding of mouse identity over days.
a, b Example neurons maintaining selective responses to the reward- and no-reward-associated mouse. c Changes in d’ values of each neuron in an example mouse. d The proportions of stable (mean ± SEM, two-sided Wilcoxon signed-rank test, p = 0.014 and 0.040 for the reward and no-reward category) and reversed neurons (two-sided Wilcoxon signed-rank test, p = 0.40 and 0.47 for the reward and no-reward category, n = 12 mice). Dashed lines indicate the chance level. No difference between the proportions of stable neurons in the reward and no-reward categories (two-sided Wilcoxon signed-rank test, p = 0.89). e Neural population activity on day 1 predicted the identity of stimulus mice from population activity on day 2 for an example pair of sessions. Upper bars indicate the period of significant decoding (Cluster-based permutation test, two-sided, p < 0.05). f Decoding accuracies of individual mice decreased as the time interval between sessions increased. The SVM decoders trained with neuronal activity patterns on day 1 were tested on each trial of day n (2 to 5). For the zero distance, within-day decoding accuracy on day 1 was calculated. Across-day decoding accuracies were maintained higher than chance (two-sided Wilcoxon signed-rank test; reward category: p = 3.8 × 10⁻⁶, 1.6 × 10⁻⁵, 5.1 × 10⁻⁴ for distance 1, 2, 3, p = 3.7 × 10⁻⁵ for 0 vs. 1; no-reward category: p = 6.0 × 10⁻⁷, 6.4 × 10⁻⁵, 9.1 × 10⁻⁴ for distance 1, 2, 3, p = 2.2 × 10⁻⁹ for 0 vs. 1). Across-day decoding accuracies were similar between reward and no-reward category (two-sided Wilcoxon signed-rank test, p = 0.71, n = 12 mice). Thin lines for each mouse. Thick lines for mean. g Within-session decoding accuracies of the identity of stimulus mice were stably high (n = 12 mice). Dashed lines in f and g represent decoding accuracies obtained from shuffled data. O, window opening. R, start of response window. C, window closing. *p < 0.05, **p < 0.01, ***p < 0.001, n.s., not significant. n.d., not determined. Source data are provided as a Source Data file.

