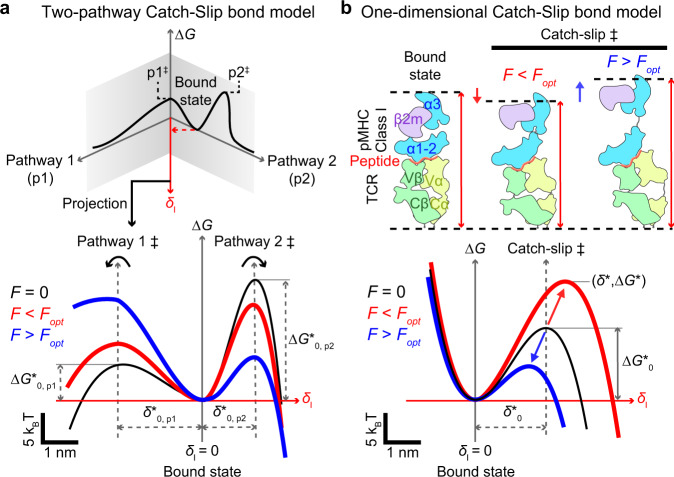
Fig. 1. Comparison between the two-pathway model and the TCR–pMHC-І model for catch bond.
a Upper: The 2D energy landscape of the two-pathway model where the bond is trapped in the bound-state energy well by two energy barriers that resist dissociation along two pathways, p1 and p2, with two distinct transition states, p1‡ and p2‡. The application of force projects the energy landscape towards a dissociation pathway along force (). Lower: Force also tilts the energy landscape, raising the energy barrier of the first pathway and lowering the energy barrier of the second pathway on the energy landscape projection (red and blue) relative to their positions in the absence of force (black). b Lower: The proposed 1D energy landscape of TCR–pMHC-І model with a single transition state δ*. Below an optimal value (Fopt), force raises the energy barrier (red) relative to the zero-force conformation (black) by contraction of flexible regions due to entropic fluctuation. Above Fopt, force lowers the energy barrier (blue) by stretching the molecular complex. Together, these two mechanisms give rise to a catch-slip bond. Upper: Schematics of the TCR–pMHC-І structure (left) and its conformational changes that correspond to low (middle) and high (right) forces. Note that in the lower panels of both (a, b), the energy wells in the absence and presence of force are aligned to the same level and the energy barrier levels are allowed to change in response to force. This convention is made throughout this paper for clear visualization because, as far as kinetic rate theory is concerned, only the energy difference between the energy barrier and energy well matters. However, this convention does not mean to suggest that force can only change the energy barrier level but not the energy well level in a real protein complex structure; to the contrary, both are possible70.

