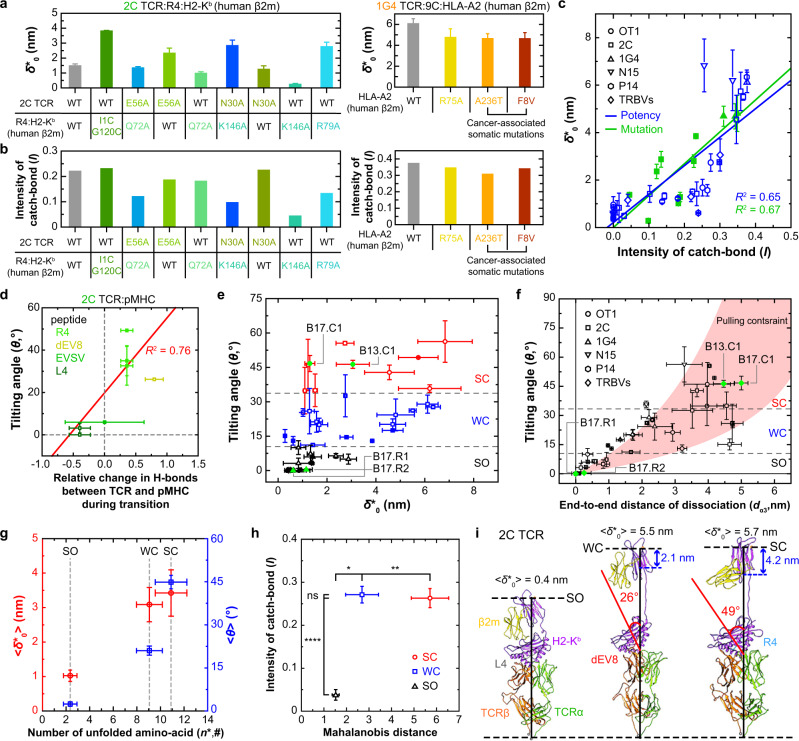
Fig. 4. Properties and biological relevance of class I model parameters.
a, b The width of zero-force energy well (a) and the single-valued catch-bond intensity I (b) calculated from WT or mutant 2C TCRs (left) and WT 1G4 TCR (right) interacting with their corresponding WT or MT pMHCs. The MT 2C TCRs and H2-Kbs were designed to destabilize the TCR–pMHC interaction. The MT p:HLA-A2s were designed to either destabilize the TCR–pMHC interaction (R75A) or stabilize the MHC intramolecular interaction (A236T and F8V). All error bars represent SE derived from fitting the model to mean ± SEM of bond lifetimes. c Data (presented as the best-fitting value ± SE) from Fig. 3e (3rd row) are re-graphed as vs plot to show their correlation (blue). Additional vs data from MT TCRs and/or MT pMHCs without functional data also show strong correlation (green). Different TCR systems are indicated by different symbols. The two datasets were separately fitted by two straight lines with the goodness-of-fit indicated by R2. d Tilting angle of the bonding interface () vs normalized net gain of hydrogen bonds at the interface between 2C TCR and the indicated pMHCs is plotted (points) and fitted (line) (error bars in x- and y axes represent SD from Supplementary Fig. 3 and SE of , respectively). e Clustering analysis shows three clusters in the - phase diagram: slip-only (SO, black), weak catch-slip (WC, blue), and strong catch-slip (SC, red) bonds. Data indicate the best-fitting value ± SE. f Tilting angle () vs end-to-end distance of dissociated α3 domain (). The three types of bonds, SO, WC, and SC, are also clustered in this phase diagram, which are separated by the dotted lines that predicted from the pulling constraints of the model. The two pairs of TRBV TCRs are indicated in e and f by green dots. Data indicate the best-fitting value ± SE. g The average molecular extensions at zero force (, left ordinate) and the average rotation angle (, right ordinate) (mean ± SEM) are plotted vs the total number of unfolded amino acids (, abscissa) to show three clusters. Each bond type is indicated by a dotted line (n = 10, 16, and 17 for numbers of data in the SO, WC, and SC groups, respectively; individual data of each cluster are shown in (e, f)). h Catch-bond intensity vs Mahalanobis distance plot (mean ± SEM), again showing three clusters. Principal component analysis was used to find principal axes. Mahalanobis distances for each cluster were calculated using common principal axes from total dataset (numbers of data are the same as (g)). ****P < 0.0001; **P < 0.01; *P < 0.05, and ns > 0.05 by one-sided unpaired t test. i Structural models illustrating the conformations of three bond types according to their model parameters based on the previous SMD simulation of the 2C TCR system6. Two structural parameters (, red;, blue) are indicated to show the differences between bond types. Unless otherwise described, all errors shown in (a–f) are SE derived from fitting the model to mean ± SEM of bond lifetimes (Supplementary Table 3). Source data are provided as a Source Data file.

