
Fig. 2. Co-expression matrix of top 10 differentially expressed genes (up- and downregulated) and selected blood markers.
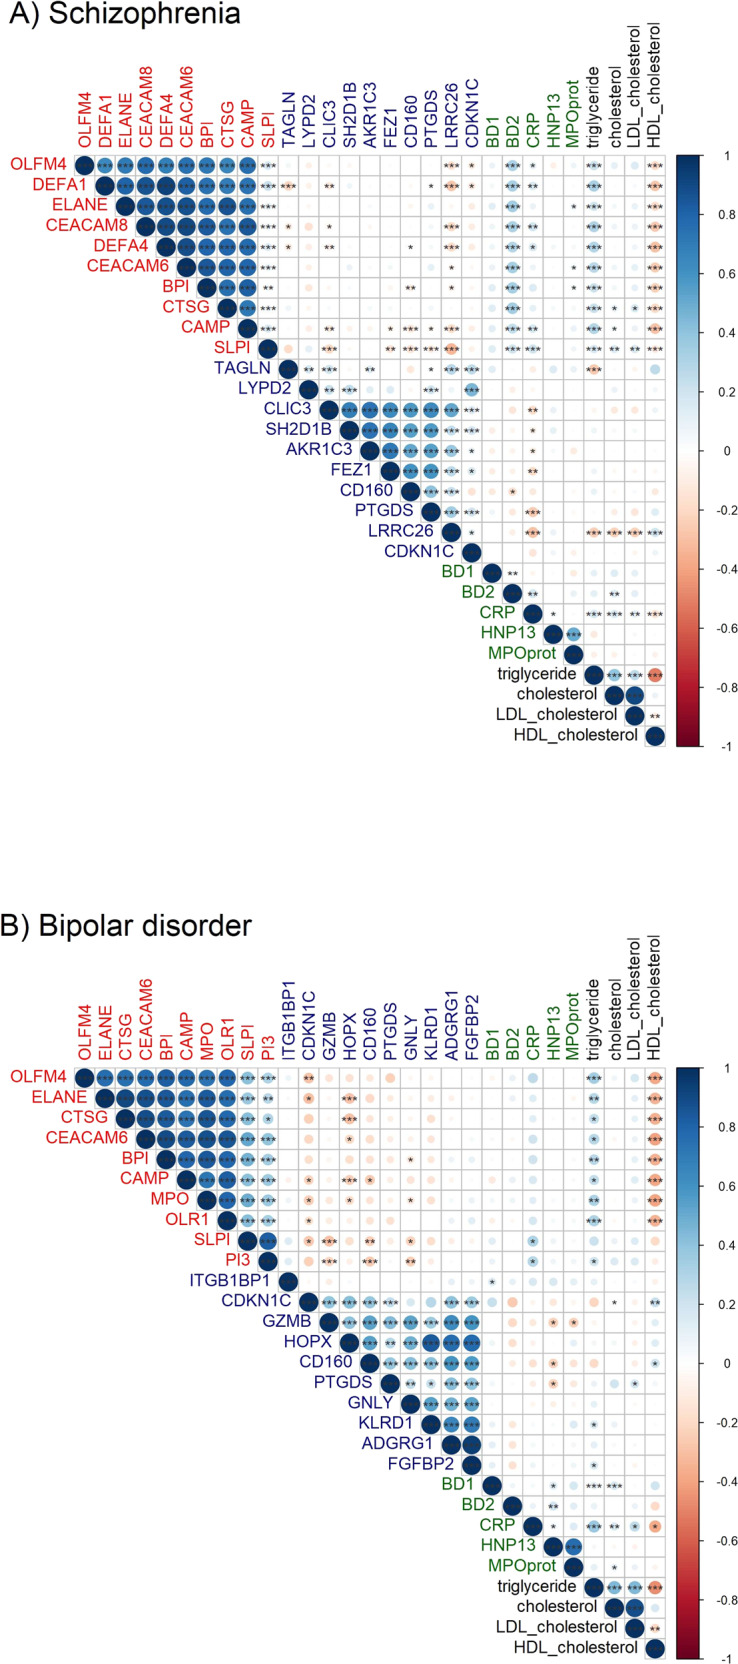
A Schizophrenia and (B) Bipolar disorder. Upregulated genes are written in red, downregulated genes in blue, serum proteins in green, and serum lipids in black. Corresponding to the strength of Pearson correlation, a positive co-expression is indicated in a gradient of blue and a negative co-expression is indicated in a gradient of red. Genes are annotated with their gene symbol. Serum protein annotation: BD1 beta defensin 1, BD2 beta defensin 2, CRP C-reactive protein, HNP13 human neutrophil peptide 1 and 3, MPOprot MPO protein (to differentiate it from the gene with the same name). Significance level is indicated with *p-value < 0.05, **p-value < 0.01 and ***p-value =≤ 0.001.