Figure 2.
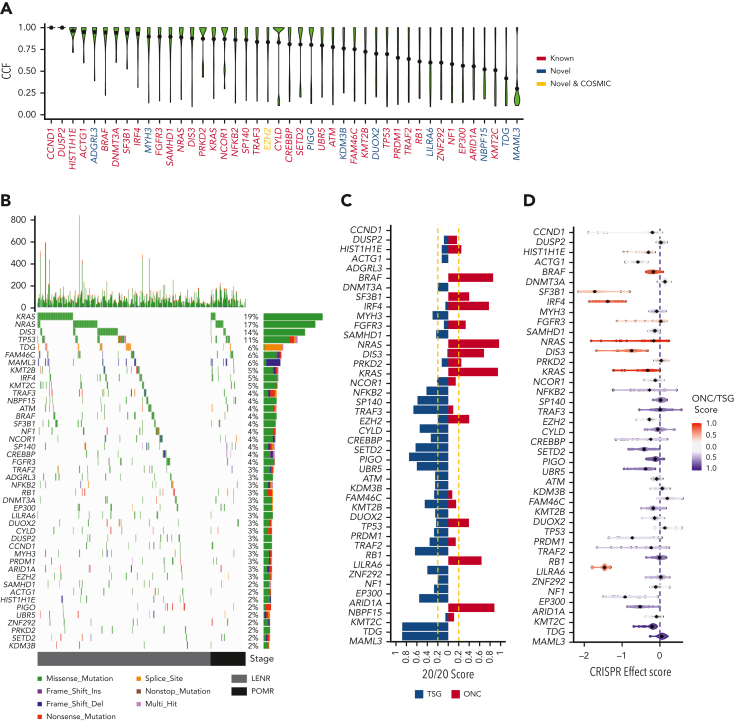
The mutational driver landscape of rrMM. (A) CCF distribution of driver genes identified in this cohort ordered by mean CCF (black dot). Gene labels are colored according to their status: known, previously reported in ndMM; novel COSMIC, newly identified but present in the COSMIC cancer gene set; and novel, not previously reported in either ndMM or COSMIC. (B) Mutational landscape of drivers identified in the rrMM cohort. The top panel represents the frequency of nonsilent mutations in each tumor across the genome. The main panel is a waterfall plot of mutations identified in each driver gene across all tumors. The right panel shows the frequency of each driver in the rrMM cohort in percentages and the type of mutations that constitute the mutation burden of each driver gene (length of the bar reflecting the frequency). All 3 panels are colored according to the functional consequence of mutations as predicted by ANNOVAR. Multi-hit: tumors with more than one mutation with different functional consequence. Tumors are ordered by their relapse stage. LENR, lenalidomide resistant; POMR, pomalidomide resistant. (C) Categorization of identified driver genes into ONC or TSG based on the 20/20 rule.16 The ONC and TSG scores are shown with red and blue color, respectively, and the vertical yellow dashed lines represent the cut-off thresholds for the 20/20 rule. Genes are ordered by mean CCF as in panel A. (D) Gene essentiality of driver genes based on the CRISPR effect score in MM cell lines where more negative values represent essential genes. Each dot represents a cell line, and the diamond represents the median value per gene. Each gene is colored based on their mean ONC/TSG score. Scores between −0.2 and 0.2 are considered inconclusive (gray). Genes are ordered by mean CCF as in panel A.

