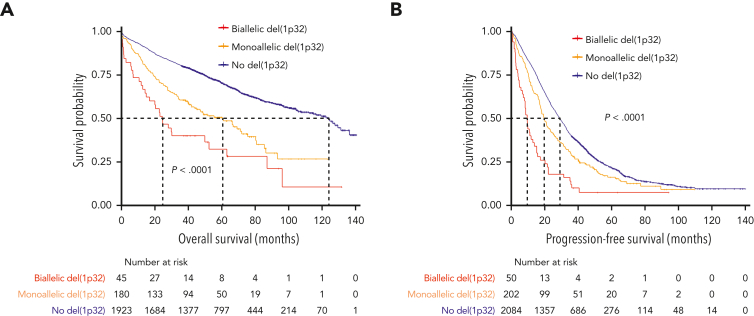
Figure 2.
Kaplan-Meier survival of patients with NDMM according to del(1p32) status. The blue curve corresponds to patients without del(1p32), the yellow curve to patients with a monoallelic del(1p32), and the red curve to patients with a biallelic del(1p32). P values are determined by the log-rank test comparison. (A) Overall survival. (B) Progression-free survival.

