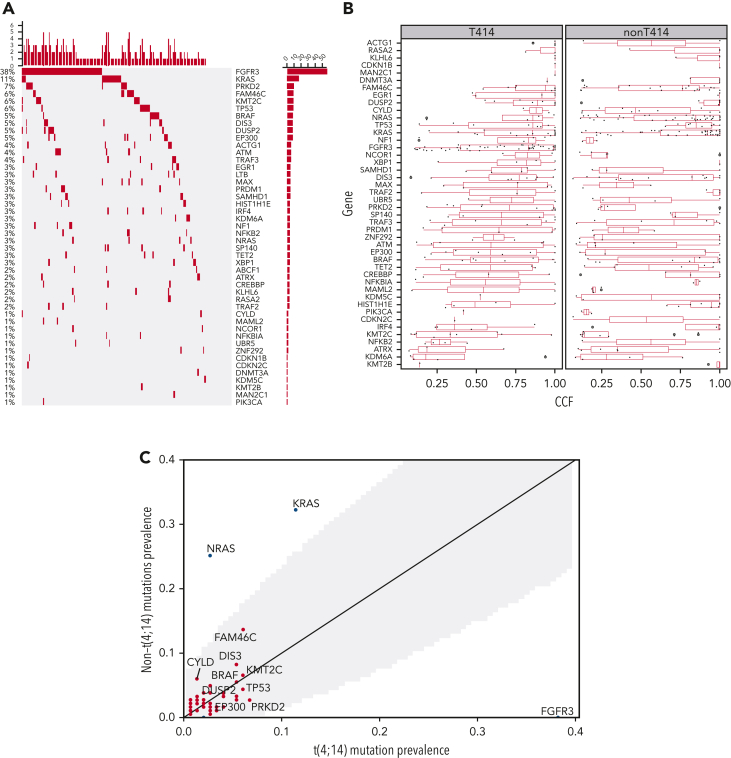
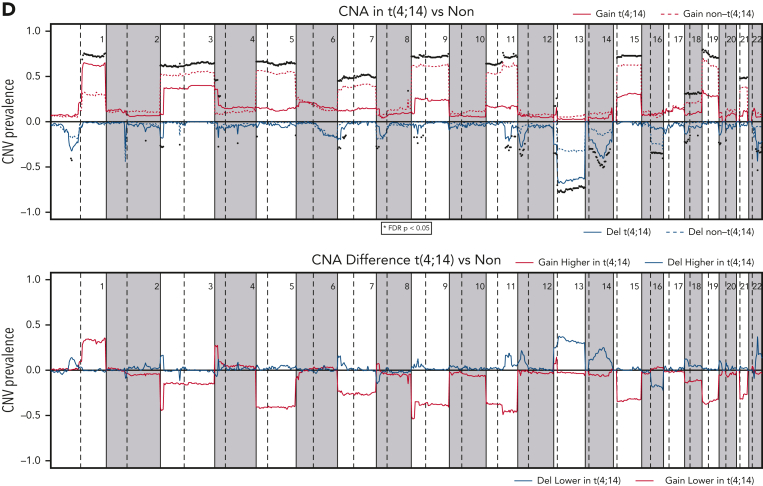
Figure 1.
Comparison of mutations and CNAs between t(4;14) and non-t(4;14) patients. (A) Waterfall plot of nonsilent mutations in the discovery cohort ordered by prevalence. Bars on the left and percentages on the left of the plot indicate prevalence of mutations in each gene. Bars at the top of the plot indicate prevalence of mutations in any of the driver genes in each patient. (B) Comparison of cancer clonal fraction (CCF) of mutations shown in panel A, starting from clonal (CCF = 1) and decreasing. t(4;14) population on the left, non-t(4;14) on the right. (C) Mutation prevalence in MM driver genes in t(4;14) patients versus non-t(4;14) patients. Shaded gray region highlights difference in mutation prevalence that are not significant. (D) Comparison of CNA gains (copy number 3+, red lines) and deletions (copy number 0-1, blue lines) between t(4;14) (solid lines) and non-t(4;14) patients (dashed lines). Black dots represent false discovery rate (FDR) P < .05.


