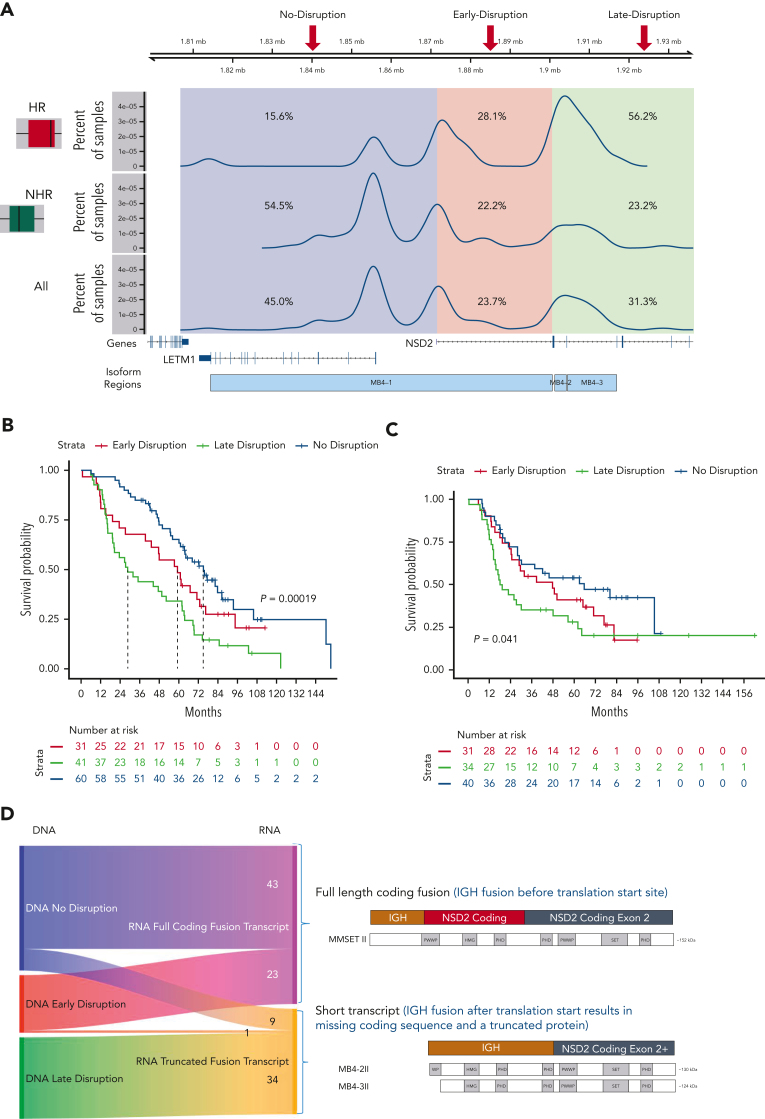
Figure 3.
Translocation breakpoint location identifies HR t(4;14) patients. (A) Breakpoint locations form 3 peaks corresponding to regions relative to NSD2. The no-disruption region (blue) occurs upstream of the start of NSD2. The early-disruption region (red) is between the start of NSD2 and the translation start of NSD2. The late-disruption region (green) is the region downstream of the NSD2 translation start site. (B) Kaplan Meir plot showing the OS of patients based on their breakpoint location. (C) Independent replication cohort showing OS of patients based on breakpoint location. (D) Sankey plot showing the relationship between sample breakpoint location and identified fusion transcript.

