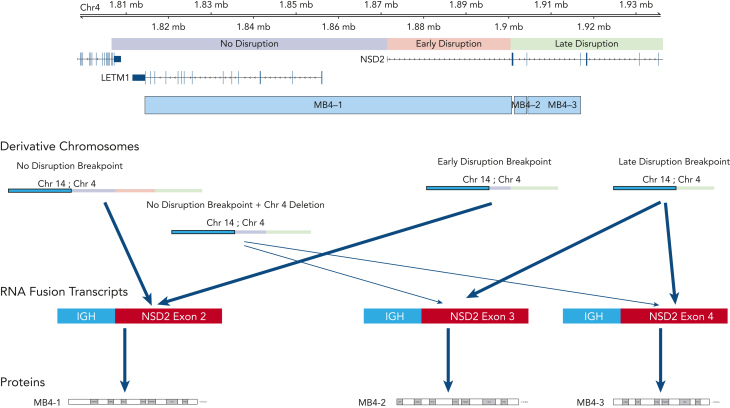
Figure 4.
Summary view of t(4;14) patients based on breakpoint location, expression of fusion transcripts, and predicted NSD2 protein. Chromosome 4 shown on top with breakpoint locations (no- vs early- vs late-disruption) shown relative to genes on chromosome 4. Resultant derivative chromosomes from different translocation breakpoints along with RNA fusion transcripts and proteins are shown.

