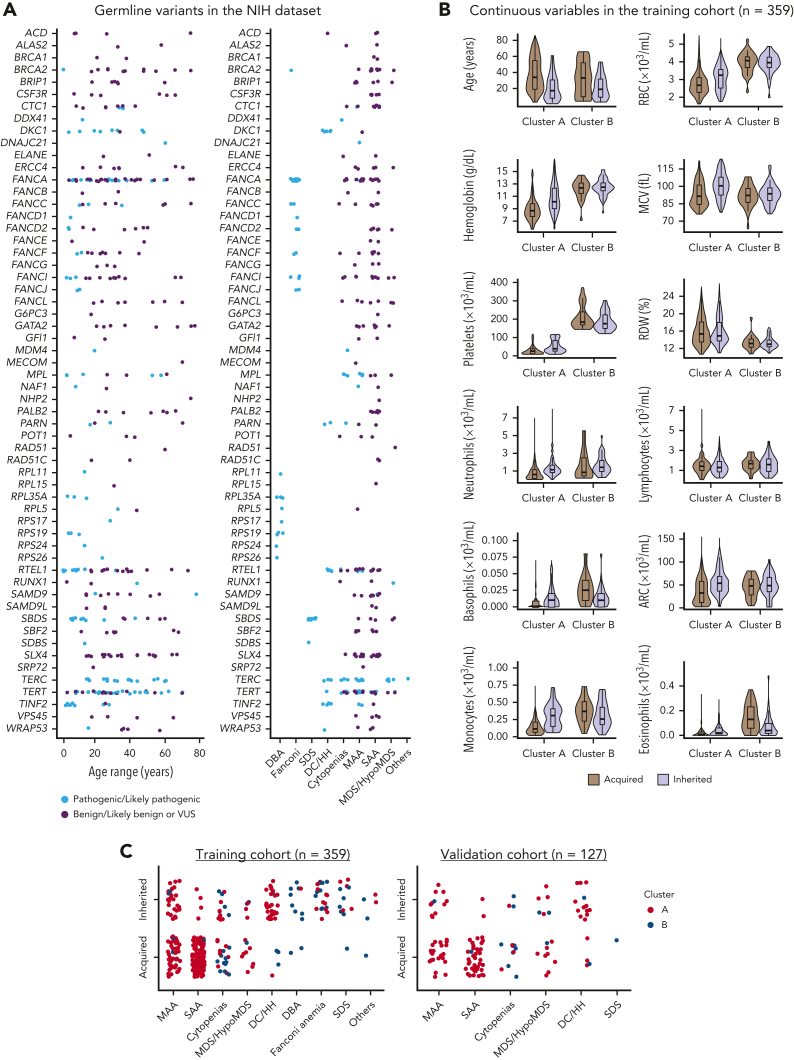
Figure 2.
Genetic and clinical characterization of cases from the NIH data set. (A) Germ line variants identified in the NIH data set (n = 399) according to patients’ ages and clinical diagnosis. Variants identified at maximum population frequency of 1% in the general population (gnomAD database) were curated and classified as pathogenic/likely pathogenic (light blue), and as benign, likely benign, or of uncertain significance (VUS; purple). Patients with pathogenic variants in IBMFS genes were labeled as inherited (n = 127). Mutations in genes linked to DBA (n = 9), FA (n = 25), SDS (n = 11), and DC/Hoyeraal-Hreidarsson syndrome (n = 28) were mostly pediatric whereas patients with AA, isolated cytopenias, or MDS/HypoMDS, due to pathogenic variants in telomere biology genes (n = 46) or other genes (RUNX1, n = 1; DDX41, n = 1; and biallelic MPL, n = 1), were in a broader age spectrum. Patients with no variants or with variants classified as benign or likely benign were labeled as acquired (n = 232). In contrast, patients with variants classified as VUS were removed from analysis (n = 40). A final training cohort (n = 359) with 127 labeled as inherited and 232 cases labeled as acquired were used for data modeling. (B) Violin plots of continuous variables in the training cohort (n = 359) according to clusters. Cluster A was enriched for patients who had lower median blood counts, whereas cluster B was enriched for patients with physical anomalies, multiorgan involvement, and long histories of cytopenias or macrocytosis (supplemental Figures 2 and 3). Median ages and blood counts, from both clusters A and B, are shown in the graphic. In general, median blood counts of patients were lower in cluster A than in cluster B and RDW was higher in cluster A than in B, possibly because of enrichment of SAA, which is often transfusion dependent. Within each cluster, inherited cases had lower median ages but higher blood counts. (C) Clinical diagnosis of patients labeled as acquired and inherited in both the training and validation cohorts. Each dot represents a single patient that is colored according to the assigned cluster.

