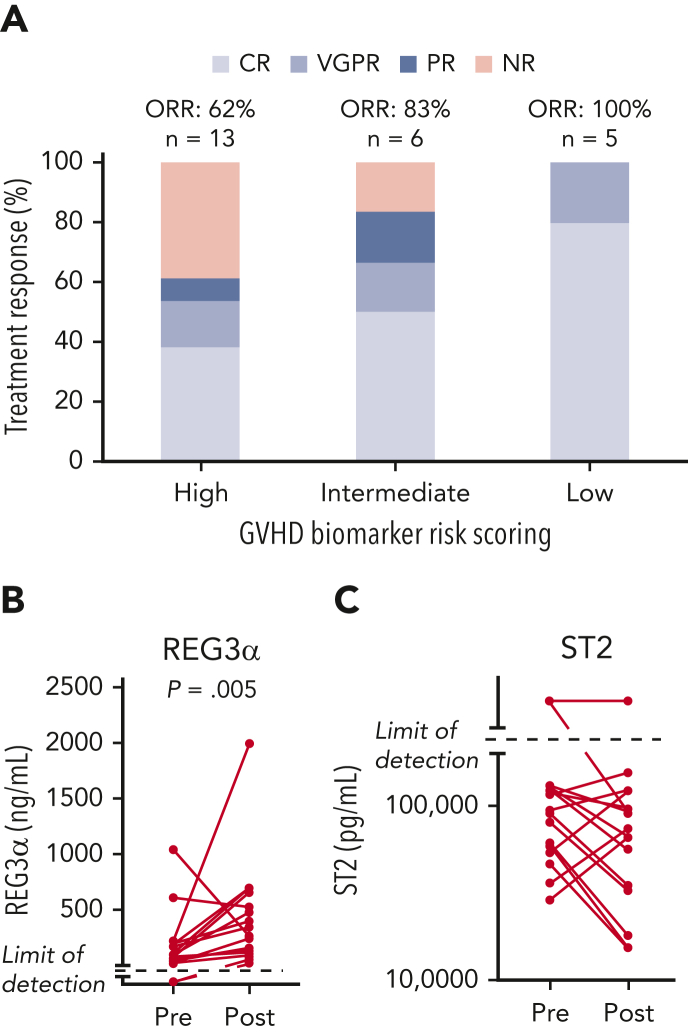
Figure 4.
GVHD biomarker–based stratification of study participants. Twenty-four patients in the study underwent GVHD risk assessment per the Mount Sinai Acute GVHD International Consortium scoring algorithm of plasma GVHD biomarkers REG3α and ST2. (A) Treatment response according to GVHD biomarker risk score at enrollment (n = 24). The majority of study participants had high or intermediate risk scores (n = 19); low-risk disease represented the minority of patients under study (n = 5.) Day-28 responses were observed in all risk groups. (B) Assessment of REG3α levels before and after F-652 treatment in 18 patients with paired plasma samples taken at study enrollment and again after completion of F-652 treatment. REG3α levels were significantly greater posttreatment when compared with baseline measurements. (C) Assessment of ST2 levels before and after F-652 treatment in 19 patients with paired plasma samples taken at study enrollment and again after completion of F-652 treatment. ST2 levels showed a mixed response posttreatment when compared with baseline measurements.

