Figure 5.
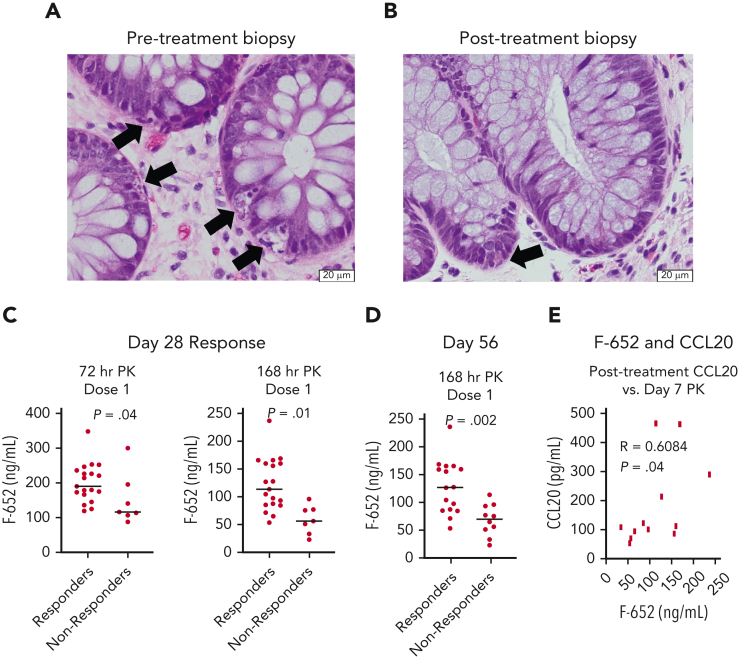
Histology and PK profiles associated with treatment response. (A-B) Representative images of hematoxylin and eosin–stained histopathology performed at the onset of aGVHD and following rhIL-22 treatment with F-652 in a small subset of patients. (A) Pretreatment biopsy: colonic biopsy with crypt injury and extensive epithelial cell apoptosis. Arrows indicate apoptotic cells. (B) Day 28 posttreatment biopsy: colonic mucosa with only rare epithelial apoptotic bodies in basal crypts. Arrow points to a single apoptotic cell. (C) Drug PK levels 3 days and 7 days following the first dose of F-652 were greater in patients who went on to become treatment responders at day 28. (D) Drug PK levels 7 days following the first dose of F-652 were greater in patients who remained treatment responders at day 56. (E) Drug PK levels 7 days following the first dose of F-652 correlated with circulating plasma CCL20 concentrations after completion of F-652 treatment.

