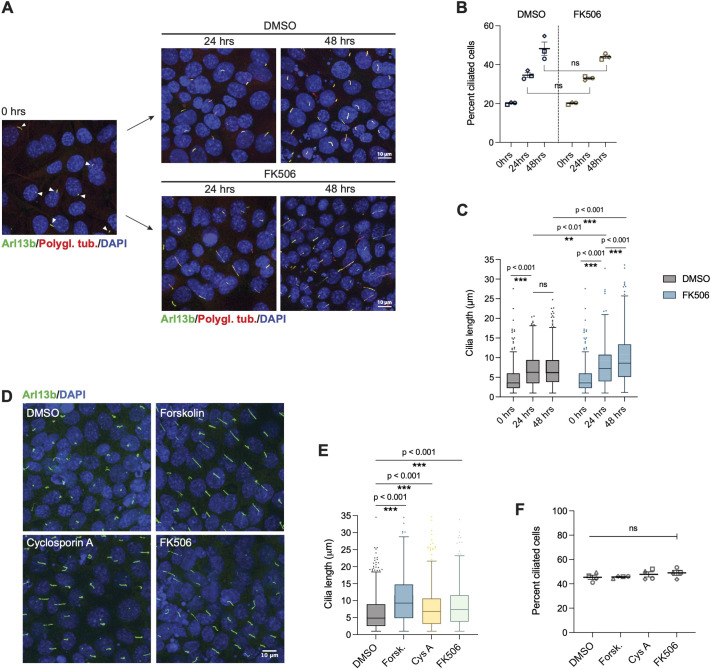
Fig. 4.
Calcineurin inhibition promotes elongation of cilia. (A) CN inhibition increases cilia length without disrupting ciliogenesis. IMCD3 cell cilia after the indicated treatments with DMSO or 2.5 μM FK506. Cells are stained to show Arl13b and polyglutamylated tubulin (polygl. tub.). White arrowheads indicate short cilia. Images are maximum-intensity projections. (B) Percentage ciliated cells quantified using images as shown in A. Data are presented as the mean±s.e.m. of n=3 independent experiments. Total n cells: 0 h, n=1319; 24 h DMSO, n=2176; 24 h FK506, n=2468; 48 h DMSO, n=3710; 48 h FK506, n=4120. ns, not significant, P>0.05 (unpaired, two-tailed Student's t-test. (C) Length of cilia quantified using images as shown in A. Boxplots show the median (line) and interquartile range (IQR; box), with Tukey whiskers indicating the 75th percentile+1.5×IQR and 25th percentile−1.5×IQR. Data pooled from three independent experiments. Total n cilia: 0 h, n=331; 24 h DMSO, n=556; 24 h FK506, n=256; 48 h DMSO, n=931; 48 h FK506, n=429. ns, not significant; **P<0.01; ***P<0.001 (two-tailed Mann–Whitney test). (D) Forskolin and CN inhibition increase cilia length but not number. IMCD3 cell cilia treated with DMSO, 10 μM forskolin or CN inhibitors (2.5 μM FK506; 2.5 μM cyclosporin A), as indicated, for 3 h. Images are maximum-intensity projections. (E) Length of cilia quantified using images as shown in D. Boxplots show the median (line) and IQR (box), with Tukey whiskers indicating the 75th percentile+1.5×IQR and 25th percentile−1.5×IQR. Data shown for one of four replicates; additional replicates are shown in Fig. S4. Total n cilia: DMSO, n=537; forskolin, n=514; cyclosporin A, n=553; FK506, n=638 cilia. ***P<0.001 (two-tailed Mann–Whitney test). (F) Percentage ciliated cells quantified using images as shown in D. Data are presented as the mean±s.e.m. of n=4 independent experiments. n>1200 cells per replicate per treatment. ns, not significant, P>0.05 (unpaired, two-tailed Student's t-test).

