Fig. 1.
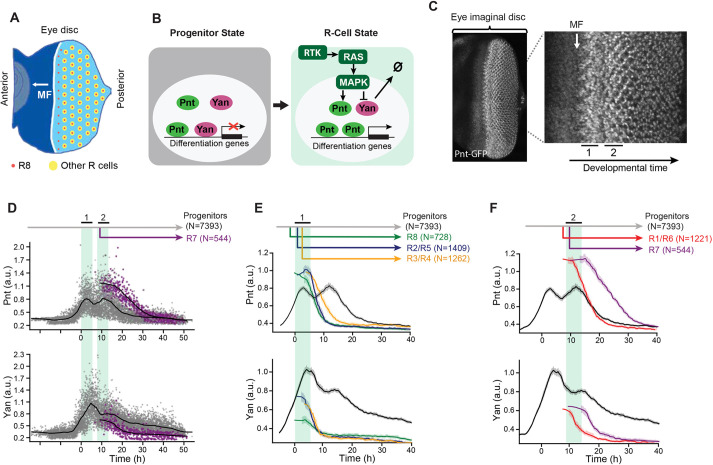
Pnt and Yan expression defines two waves of cell state transitions. (A) Schematic of a developing eye disc ∼100 h post-fertilization. The passage of the morphogenetic furrow (MF) (white arrow) initiates R cell fate specification. Specification of regularly spaced R8 cells (red dots) marks the start of ommatidial assembly and is followed by recruitment of additional R-cell types (yellow dots). Adapted from Peláez et al. (2015), where it was published under a CC-BY 4.0 license. (B) Schematic summary of RTK-mediated regulation of progenitor to R-cell fate transitions. Progenitor cells co-express Pnt and Yan (left). In response to RTK signals, cells increase Pnt and decrease Yan (right). (C) Maximum intensity projection of Pnt-GFP fluorescence in an eye disc oriented anterior left and dorsal up. Magnified view shows that the two zones where progenitor cells undergo fate transitions coincide with peaks of Pnt-GFP (black bars, labeled 1 and 2). (D) Pnt-GFP and Yan levels in individual progenitor (gray) and R7 (purple) cells over developmental time. N is the number of cells analyzed in each group. Progenitor cells are present across all times (gray arrow), while R7 cells arise later in time (purple arrow). Solid black lines are smoothed moving averages across 250 and 75 individual nuclei for progenitor and R7 cells, respectively. Black bars labeled 1 and 2 indicate the two peaks of Pnt-GFP in progenitor cells. Shaded vertical stripes highlight these two regions, which coincide with the transition of progenitors to various R fates. Although time appears continuous in these plots (see Materials and Methods), temporal resolution is about 2 h, i.e. the time between specification of each column of R8 cells. (E,F) Line averages, with 95% confidence intervals shaded, for Pnt-GFP and Yan levels in progenitor (gray), R8 (green), R2/R5 (blue), R3/R4 (orange), R1/R6 (red) and R7 (purple) cells over developmental time. N is the number of cells analyzed in each group.

