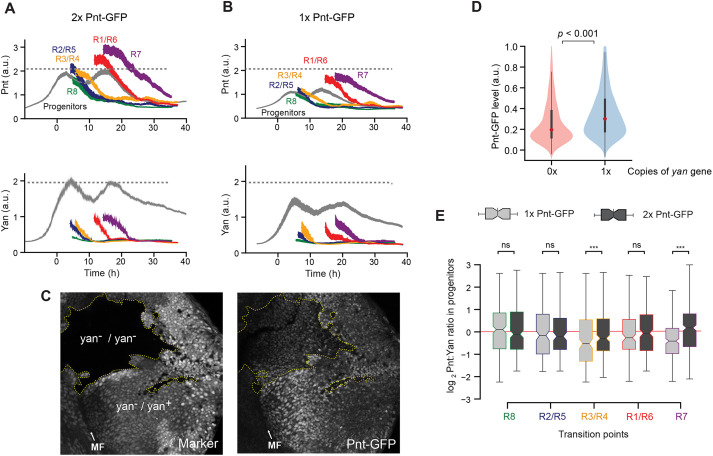
Fig. 2.
Pnt and Yan activate the expression of one another. (A,B) Line averages, with 95% confidence intervals shaded, for Pnt-GFP and Yan levels in progenitor and R cells containing two copies (A) or one copy (B) of the pnt-GFP gene. The number of cells analyzed for each cell class ranged from 312 (R7 cells) to 3127 (progenitors) in A, and from 271 (R7 cells) to 2834 (progenitors) in B. (C) Confocal sections showing progenitor cell nuclei in an eye disc containing several patches (clones) of homozygous yan mutant cells, marked by lack of RFP and outlined by dotted yellow lines. Right panel: Pnt-GFP fluorescence signal is lower in the yan mutant clones. (D) Pnt-GFP abundance is significantly lower in homozygous yan mutant (0×) versus heterozygous (1×) progenitor cells. Violin plots contain red dots that indicate the median of each distribution and gray lines that indicate the interquartile range. P<0.001, Mann–Whitney U-test. (E) Comparison of Pnt/Yan ratios in progenitor cells with one copy (light gray) versus two copies (dark gray) of the pnt-GFP gene. Cells were differentially sampled across five time-windows of cell fate transitions. These time windows were defined in each disc by the time spanned by the first ten identifiable R cells of a given class. Progenitor cells were sampled from these time windows. Median ratios, boxed by the quartile ratios, are shown. Whiskers indicate the upper- and lower-most quartile ratios. The ratio in progenitor cells is statistically indistinguishable between cells bearing different gene doses during the R8, R2/R5 and R1/R6 cell fate transitions (Kolmogorov-Smirnov two-sample test; ns, P>0.1; ***P<0.001).

