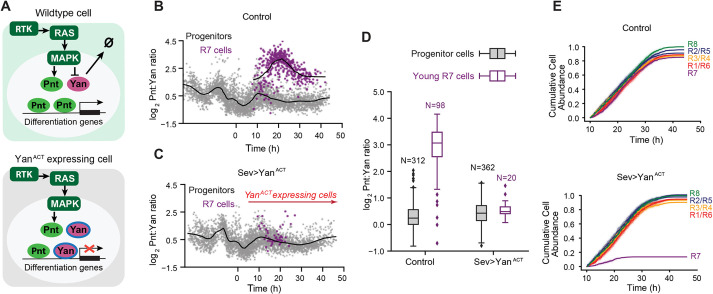
Fig. 5.
An artificial decrease in the Pnt/Yan ratio biases progenitor cells against an R fate. (A) Schematic showing the effect of YanACT on signal transduction, and Yan and Pnt expression in eye cells. (B) The log2-transformed Pnt/Yan ratio in wild-type control progenitor (gray, 3796 cells) and R7 (purple, 413 cells) cells, and their moving line averages (solid black lines). (C) The log2-transformed Pnt/Yan ratio in sev>YanACT progenitor (gray) and R7 (purple) cells, and their moving line averages (solid black lines). Red arrow indicates the time during which cells express YanACT. (D) The log2-transformed ratio of Pnt/Yan in wild-type control and sev>YanACT young R7 cells. Progenitor cells (gray) that were present in the timespan of these young R7 cells (purple) were also analyzed. Box plots show the median (horizontal line) and quartiles (upper and lower edges of the box). Whiskers indicate the upper- and lower-most quartile ratios. N is number of cells analyzed in each group. (E) Cumulative abundance of each R cell type as a function of developmental time in wild-type (top) and sev>YanACT (bottom) eye discs. Counts are normalized by the total number of R8 cells detected across the time-course, and R2, R5, R3, R4, R1 and R6 cells are each tallied separately. Shading indicates 95% confidence intervals.

