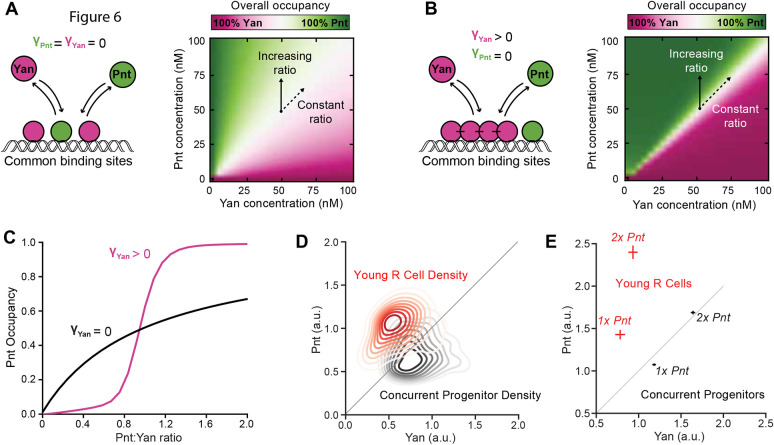
Fig. 6.
Cooperative binding by Yan greatly sensitizes DNA occupancy to the Pnt/Yan ratio. (A) Left: schematic showing that Pnt and Yan compete for occupancy of mutual DNA-binding sites when Yan is unable to self-polymerize. Right: overall binding site occupancy calculated as a function of transcription factor abundance. We use a diverging scale because all sites are fully saturated at total transcription factor concentrations above 1 nM. Under the range of conditions shown, this implies that Yan occupies all sites left vacant by Pnt. Simultaneous proportional increases in absolute abundance of both species have minimal impact on Pnt occupancy (dashed arrow), while a varying ratio confers gradual change (solid arrow). (B) Left: schematic of Pnt and Yan competition for occupancy of mutual DNA binding sites when Yan can self-polymerize. Right: overall binding site occupancy calculated as a function of transcription factor abundance. The sharpness of the transition between all-Pnt occupancy and all-Yan occupancy is increased compared with A. (C) Average Pnt occupancy across all binding sites as a function of the Pnt/Yan ratio when Yan is unable to self-polymerize (black line) versus when Yan can self-polymerize (pink line). Contours correspond to vertical paths traversed across the phase-plots in A and B at a fixed Yan concentration of 50 nM. (D) Probability density function of experimentally measured Pnt-GFP and Yan levels for the combined populations of all young R cells (red) and concurrent progenitor cells (black). Contours decrease in opacity with decreasing density and are not shown for values below 0.1. Density function is estimated using Gaussian kernels with a bandwidth selected using Scott's rule. A thin diagonal line shows a constant Pnt/Yan ratio to aid interpretation. (E) Experimentally measured average Pnt-GFP and Yan levels for the combined populations of all young R cells (red) and concurrent progenitor cells (black), sampled from eye discs containing either one (1x Pnt) or two (2x Pnt) copies of the pnt-GFP gene. Horizontal and vertical lines through each point indicate s.e.m. A thin diagonal line shows a constant Pnt/Yan ratio to aid interpretation.

