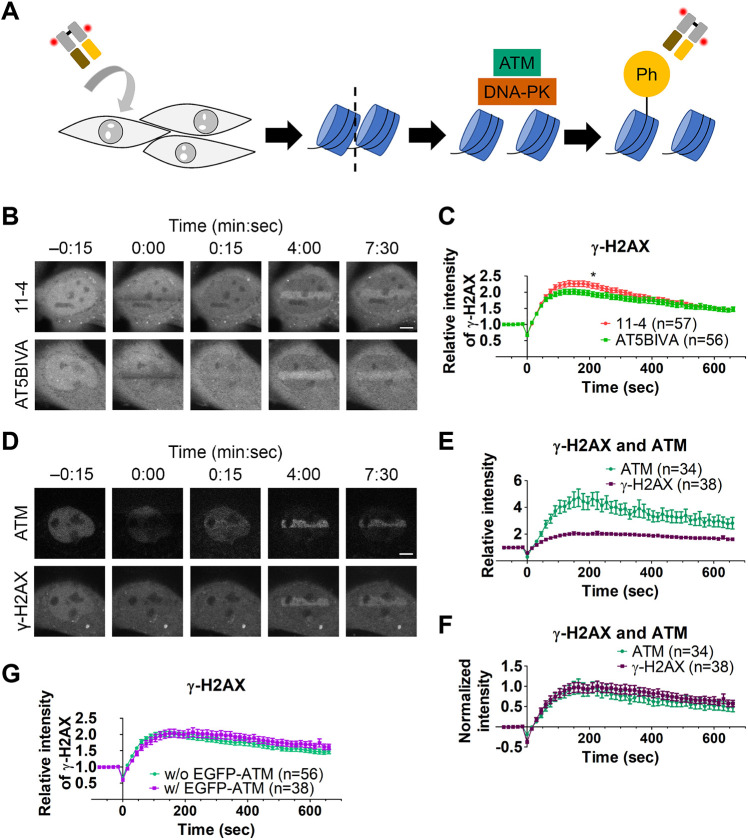
Fig. 1.
Dynamics of ATM and γ-H2AX after DSB induction by 405-nm laser bleaching. (A) Schematic diagram of the experimental system showing how the formation of phosphorylated H2AX (γ-H2AX) in response to a DSB is detected in living cells. A fluorescent dye-conjugated γ-H2AX-specific Fab is loaded into cells, and then DNA damage is induced by 405-nm laser irradiation. ATM and DNA-PK are recruited to DNA lesions and phosphorylate histone H2AX to form γ-H2AX, which is now recognized by the Fab. Thus, the localization and degree of γ-H2AX can be monitored by live-cell imaging. (B,C) Monitoring of γ-H2AX in response to laser microirradiation in ATM-proficient (11-4) and -deficient (AT5BIVA) cells. Cy5-conjugated γ-H2AX Fab had been loaded into 11-4 and AT5BIVA cells and rectangular areas were then irradiated to induce DSBs. (B) Time-lapse images. In the irradiated areas, fluorescence was bleached just after irradiation (0:00) and then increased (4:00 and 7:30). (C) Accumulation kinetics of γ-H2AX. The relative intensities of γ-H2AX Fab in the irradiated areas in 11-4 and AT5BIVA cells are plotted (mean±s.e.m., with the total number of cells indicated as n from three replicates; see Fig. S1B,C for data in individual replicates). *P<0.05 (P=0.056 at 105 s, P=0.019 at 210 s, and P=0.066 at 315 s; unpaired, two-tailed Student's t-test). (D–F) Monitoring EGFP–ATM and γ-H2AX in response to laser microirradiation. (D) Time-lapse images. AT5BIVA cells that express EGFP–ATM plasmid were loaded with Cy5-conjugated γ-H2AX Fab and rectangular areas were irradiated to induce DSBs. Both EGFP–ATM and γ-H2AX accumulated in the irradiated areas. (E,F) The accumulation kinetics of EGFP–ATM and γ-H2AX in the irradiated area. (E) The relative intensities (mean±s.e.m., with the total number of cells indicated as n from two replicates). (F) Normalized intensities from the baseline before irradiation to the maximum (P=0.906 at 105 s, P=1.000 at 210 s, and P=0.351 at 315 s; unpaired, two-tailed Student's t-test). (G) Comparison of the accumulation kinetics of Cy5-conjugated γ-H2AX Fab in irradiated areas in AT5BIVA cells without (w/o) and with (w/) EGFP–ATM, reproduced from data in C and E. No significant difference is seen (P=0.477 at 105 s, P=0.485 at 210 s, and P=0.183 at 315 s; unpaired, two-tailed Student's t-test). Scale bars: 5 μm.

