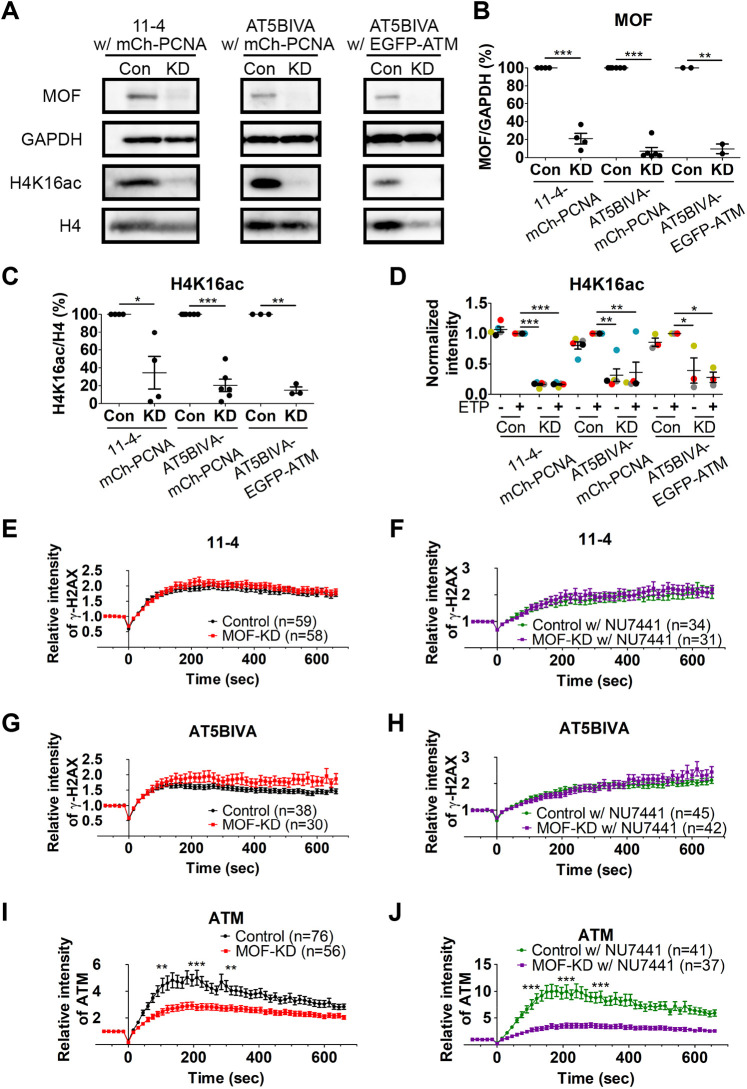
Fig. 3.
Effects of MOF knockdown on the accumulation of γ-H2AX. Lentivirus to cause expression of MOF-specific (KD) and control-scramble shRNA (Con) was used to infect 11-4 and AT5BIVA cells that expressed mCherry (mCh)–PCNA, or AT5BIVA cells that also expressed EGFP–ATM. (A–D) Validation of MOF knockdown. (A) Immunoblots showing decreased levels of MOF. (B,C) Relative amounts of MOF and H4K16ac evaluated by immunoblotting. The band intensities of MOF (B) and H4K16ac (C) are normalized against those of GAPDH and histone H4, respectively, and further normalized using Con. Plots show between two and six biologically independent experiments (mean±s.e.m., with individual data points). (D) Fluorescence intensity of H4K16ac in MOF knockdown cells (mean±s.e.m.; n=3–5 independent experiments indicated by different colors; ≥115 cells were analyzed in each experiment). *P<0.05; **P<0.01; ***P<0.001 (one-way ANOVA test with Tukey test as the post hoc analysis). (E–H) Accumulation kinetics of γ-H2AX. Means±s.e.m. with the total number of cells (indicated as n) from between two and four replicates are shown. (E) 11-4 cells with MOF-KD and Con (P=0.725 at 105 s, P=0.100 at 210 s, and P=0.419 at 315 s). (F) 11-4 cells in 2.5 μM NU7441 with MOF-KD and Con (P=0.258 at 105 s, P=0.636 at 210 s, and P=0.235 at 315 s). (G) AT5BIVA cells with MOF-KD and Con (P=0.408 at 105 s, P=0.062 at 210 s, and P=0.100 at 315 s). (H) AT5BIVA cells in 2.5 μM NU7441 with MOF-KD and Con. (I,J) Accumulation kinetics of ATM in AT5BIVA cells that express EGFP–ATM (P=0.275 at 105 s, P=0.299 at 210 s, and P=0.937 at 315 s). (I) Cells without NU7441 with MOF-KD and Con (P=0.001 at 105 s, P=0.0003 at 210 s, and P=0.001 at 315 s). (J) Cells in 2.5 μM NU7441 with MOF-KD and Con (P<0.0001 at 105, 210, and 315 s). ***P<0.001 (unpaired, two-tailed Student's t-test). w/, with; w/o, without.

