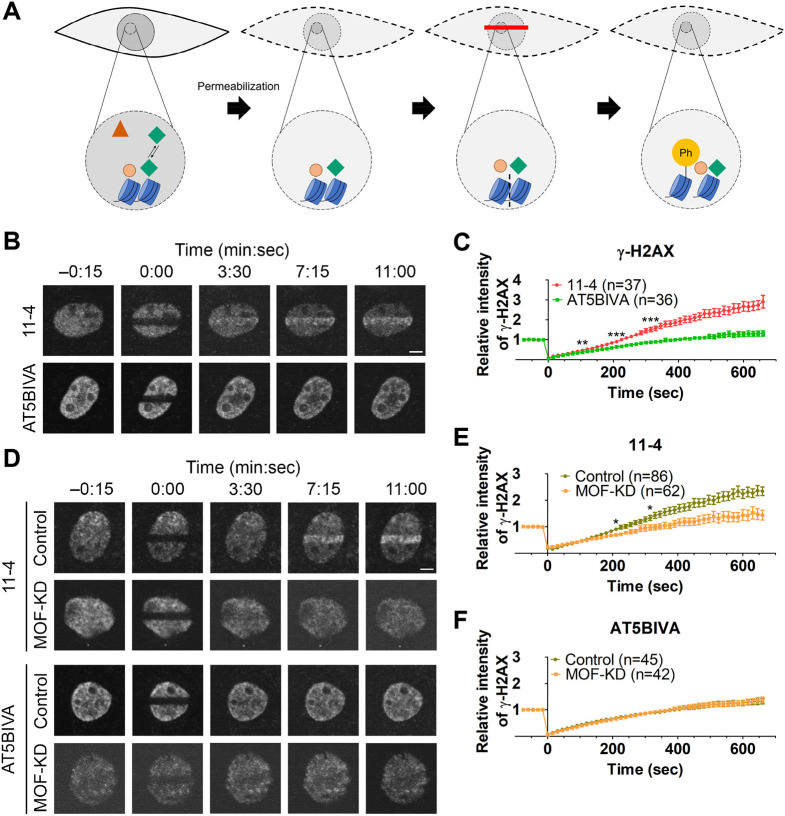
Fig. 5.
H2AX phosphorylation activity in permeabilized cells. (A) Schematic diagram of cell permeabilization and H2AX phosphorylation. Within the intact cells, some proteins (indicated as the red triangle) diffuse freely and others transiently bind to the chromatin (first panel). When cells are permeabilized with 0.1% Triton X-100, only proteins that are not bound to chromatin are extracted (second panel). After DSBs are induced by laser irradiation, histone H2AX becomes phosphorylated if a kinase remains on chromatin in permeabilized cells (third and fourth panels). The γ-H2AX in permeabilized cells can be detected by the accumulation of dye-labeled specific Fab. (B,C) 11-4 and AT5BIVA cells were permeabilized and laser-irradiated in the presence of Cy5-conjugated γ-H2AX Fab. Time-lapse images (B) and accumulation kinetics of γ-H2AX at the irradiated areas (C) are shown (P=0.004 at 105 s, and P<0.0001 at 210 s and 315 s). (D–F) MOF was knocked down in 11-4 and AT5BIVA cells before permeabilization and laser irradiation. (D) Time-lapse images. (E,F) Accumulation of γ-H2AX at the irradiated areas. (E) 11-4 cells (P=0.780 at 105 s, P=0.012 at 210 s, and P=0.011 at 315 s). (F) AT5BIVA (P=0.073 at 105 s, P=0.457 at 210 s, and P=0.956 at 315 s). Means±s.e.m. with the number of cells (indicated as n) from two or three replicates are shown. *P<0.05; **P<0.01; ***P<0.001; ns, not significant (unpaired, two-tailed Student's t-test). Scale bars: 5 μm.

