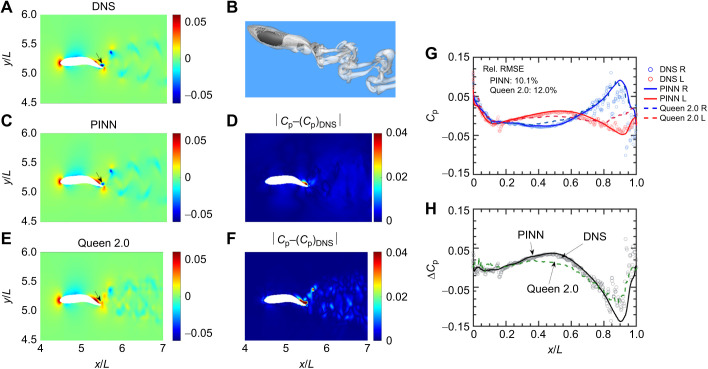
Fig. 1.
Comparison of the 2D pressure field and surface pressure profiles predicted by the physics-informed neural network (PINN) and Queen 2.0. (A) The 2D dimensionless pressure (Cp) data cut through the mid-plane of the fish from (B) the full 3D direct numerical simulation (DNS) results. (C–F) The reconstructed pressure fields and their associated absolute error for each method. The arrows denote a region where the localized error in the Queen 2.0 prediction is much larger than PINN. (G) The surface pressure profiles, including the DNS results (circles) and the prediction from the PINN (solid) and Queen 2.0 (dashed), on the right (R, blue) and left (L, red) sides of the fish body. (H) The dimensionless pressure difference (ΔCp) between the left and right side of the body predicted by each method. In all panels, L refers to the fish body length.

