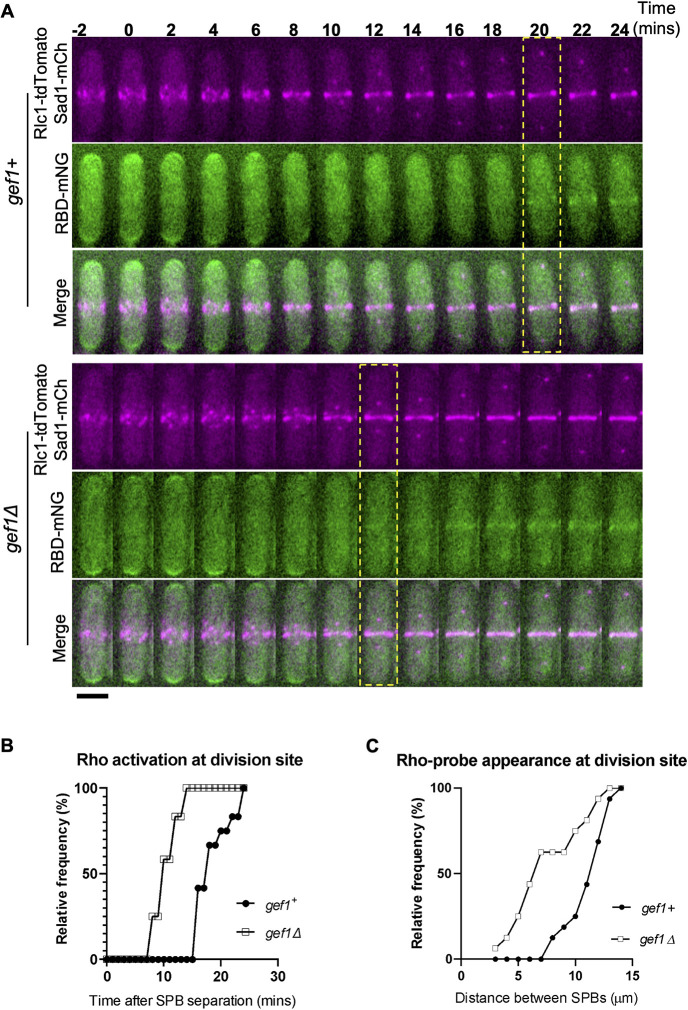
Fig. 3.
Loss of gef1 results in early Rho1 activation in cytokinesis. (A) Time-lapse montage showing the time of Rho activation (RBD–mNG) at the division site in representative gef1+ and gef1Δ cells (yellow dotted box), Time=0 marks the time of SPB separation, and onset of cytokinetic events. Scale bar: 5 µm. (B) Outcome plot showing frequency of Rho-activation over time during cytokinesis from time-lapse movies of strains as indicated (n=12 cells from time-lapse movies). (C) Outcome plot shows frequency distribution of SPB distances at which Rho-activation at the division site is observed in acquired still images of gef1+ and gef1Δ cells (n=16 cells per indicated strain).

