
Fig. 4.
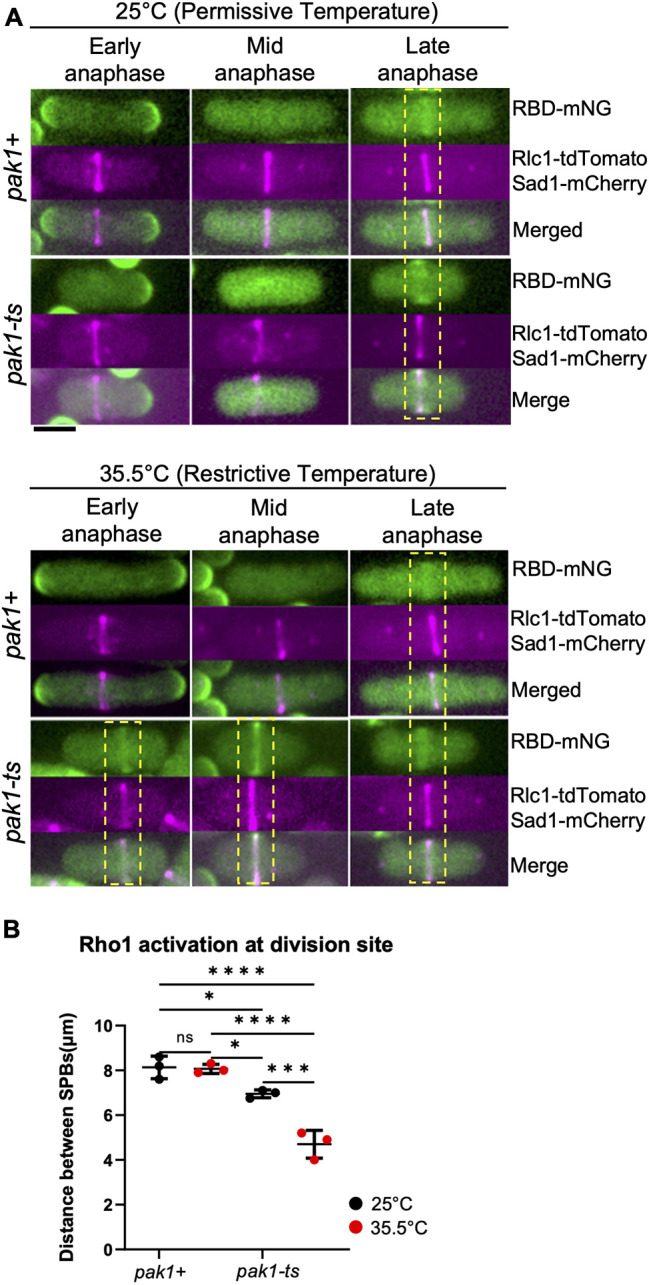
A hypomorphic pak1 mutant displays early Rho1 activation in cells during cytokinesis. (A) Rho1 activation (RBD–mNG) in pak1+ (orb2+) and pak1-ts (orb2-34) strains at the permissive temperature (25°C), and restrictive temperature (35.5°C). Yellow dotted boxes highlight the stage of cytokinesis in which Rho1 activation is observed at the division site in the indicated strains. Scale bar: 5 μm. (B) Outcome plot showing frequency distribution of the quantified distance between the SPBs at which Rho1 activation at the division site is observed in all conditions shown (mean±s.d; n=3 representative experiments). Data points on the graph represent the first quartile of SPBs distances measured in the indicated strains. *P≤0.03; ***P≤0.0008; ****P≤0.0001; ns, not statistically significant between strains (one-way ANOVA followed by Tukey's HSD test).