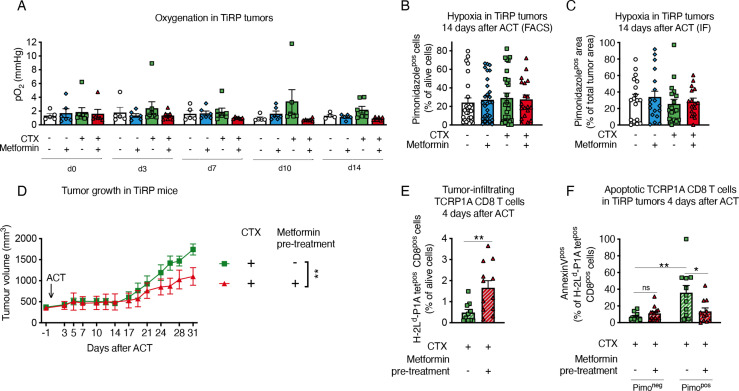
Figure 3.
Metformin does not affect tumor hypoxia in TiRP mice. (A) Measurements of tumor oxygenation by in vivo electron paramagnetic resonance (EPR) oximetry in TiRP mice that have received a single injection of cyclophosphamide (CTX, 100 mg/kg) or phosphate buffered saline (PBS) when the tumor size was around 260 mm3, followed on day 0 by adoptive cell transfer (ACT) of 10 million activated TCRP1A CD8 T cells 24 hours later and treated or not with metformin (0.5 mg/mL) in drinking water (A, PBS: n=5; PBS+metformin: n=6; CTX: n=8; CTX+metformin: n=6). (B, C) Tumor hypoxia quantification through pimonidazole staining in TiRP mice treated as in figure 2, by fluorescence-activated cell sorting (FACS) (B) or immunofluorescence (IF) (C), 14 days after ACT (B, PBS: n=25; PBS+metformin: n=29; CTX: n=27; CTX+metformin: n=19; C, PBS: n=15; PBS+metformin: n=17; CTX: n=14; CTX+metformin: n=19). (D) Tumor growth in TiRP mice that have received a single injection of CTX (100 mg/kg) followed the day after by ACT of TCRP1A CD8 T cells pretreated or not with metformin in vitro for 3 days before ACT (D, CTX: n=12; CTX+metformin pretreatment: n=11). (E, F) FACS analysis of TCRP1A CD8-T cell tumor infiltration (E) and apoptosis among pimonidazole-negative or pimonidazole-positive cells (F) in TiRP tumors treated as in (D), 4 days after ACT (E, CTX: n=10; CTX+metformin pretreatment: n=12; F, CTX: n=11; CTX+metformin: n=13). All data are mean±SEM. ns, not significant; *p<0.05; **p<0.01, calculated by two-way analysis of variance in (D), two-tailed unpaired t-test in (E, F).

