Figure 5.
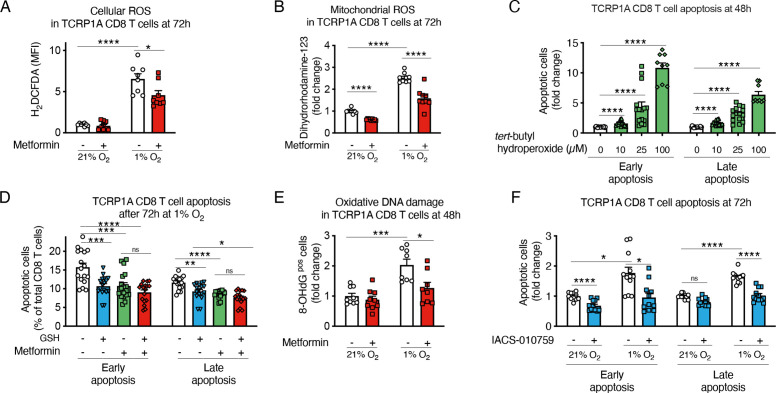
Metformin prevents hypoxia-induced apoptosis by reducing reactive oxygen species (ROS) production. (A, B) Fluorescence-activated cell sorting (FACS) quantification of cellular ROS (A) and mitochondrial ROS (B) in activated TCRP1A CD8 T cells incubated in normoxia (21% O2) or hypoxia (1% O2) in presence or not of metformin (2 mM) at 72 hours; data are expressed as fold change compared with control. (C) FACS quantification of early (Annexin Vpos and 7-aminoactinomycin D (7-AAD)neg) and late apoptosis (Annexin Vpos and 7-AADpos) in activated TCRP1A treated with different doses of tert-butyl hydroperoxide for 48 hours; data are expressed as fold change compared with control. (D) FACS quantification of early (Annexin Vpos and 7-AADneg) and late apoptosis (Annexin Vpos and 7-AADpos) in activated TCRP1A incubated in hypoxia (1% O2) in presence or not of metformin (2 mM) and/or glutathione (GSH) (3.2 mM). (E) Immunofluorescence (IF) quantification of 8-OHdG positive cells among TCRP1A CD8 T cells treated as in A, B for 48 hours by IF; data are expressed as fold change compared with normoxia vehicle. (F) FACS quantification of early (Annexin Vpos and 7-AADneg) and late apoptosis (Annexin Vpos and 7-AADpos) in activated TCRP1A incubated in normoxia (21% O2) or hypoxia (1% O2) in presence or not of IACS-010759 (100 nM); data are expressed as fold change compared with normoxic control. (A, B, E) is a pool of three independent experiments; (C) is a pool of five independent experiments (100 µM dose was assessed in three independent experiments); (D) is a pool of six independent experiments; (F) is a pool of four independent experiments. All the conditions are assessed in triplicate in each individual experiment. MFI, median fluorescence intensity. All data are mean±SEM. ns, not significant; *p<0.05; **p<0.01; ***p<0.001; ****p<0.0001, calculated by two-tailed unpaired t-test.

