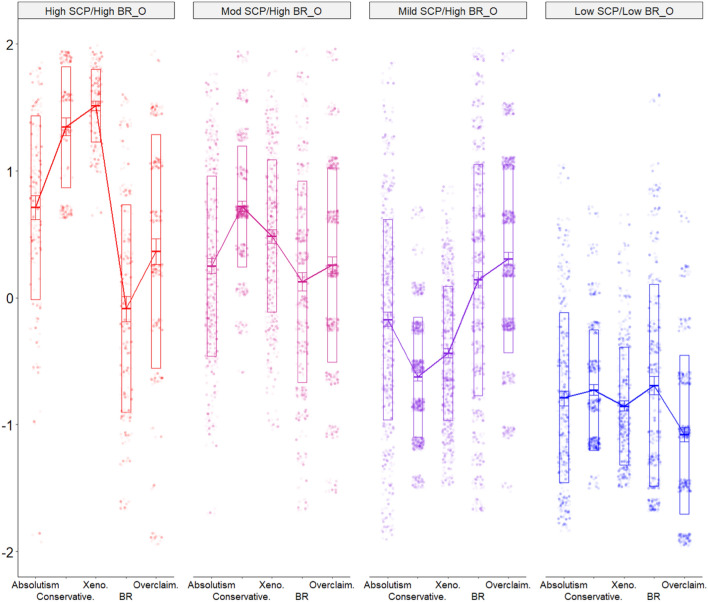
Fig. 1.
Centroids (means) and raw data for the final 4-profile solution. Individual points indicate standardized scores for each profile member on each indicator variable. The transparency of each point is weighted by the posterior probability of that observation belonging to that profile group; Lower probability points are less visible. Error bars indicate 95% CI, crossbars indicate ± 1 SD, BR_O bullshit receptivity and overclaiming, SCP socio-cognitive polarization

