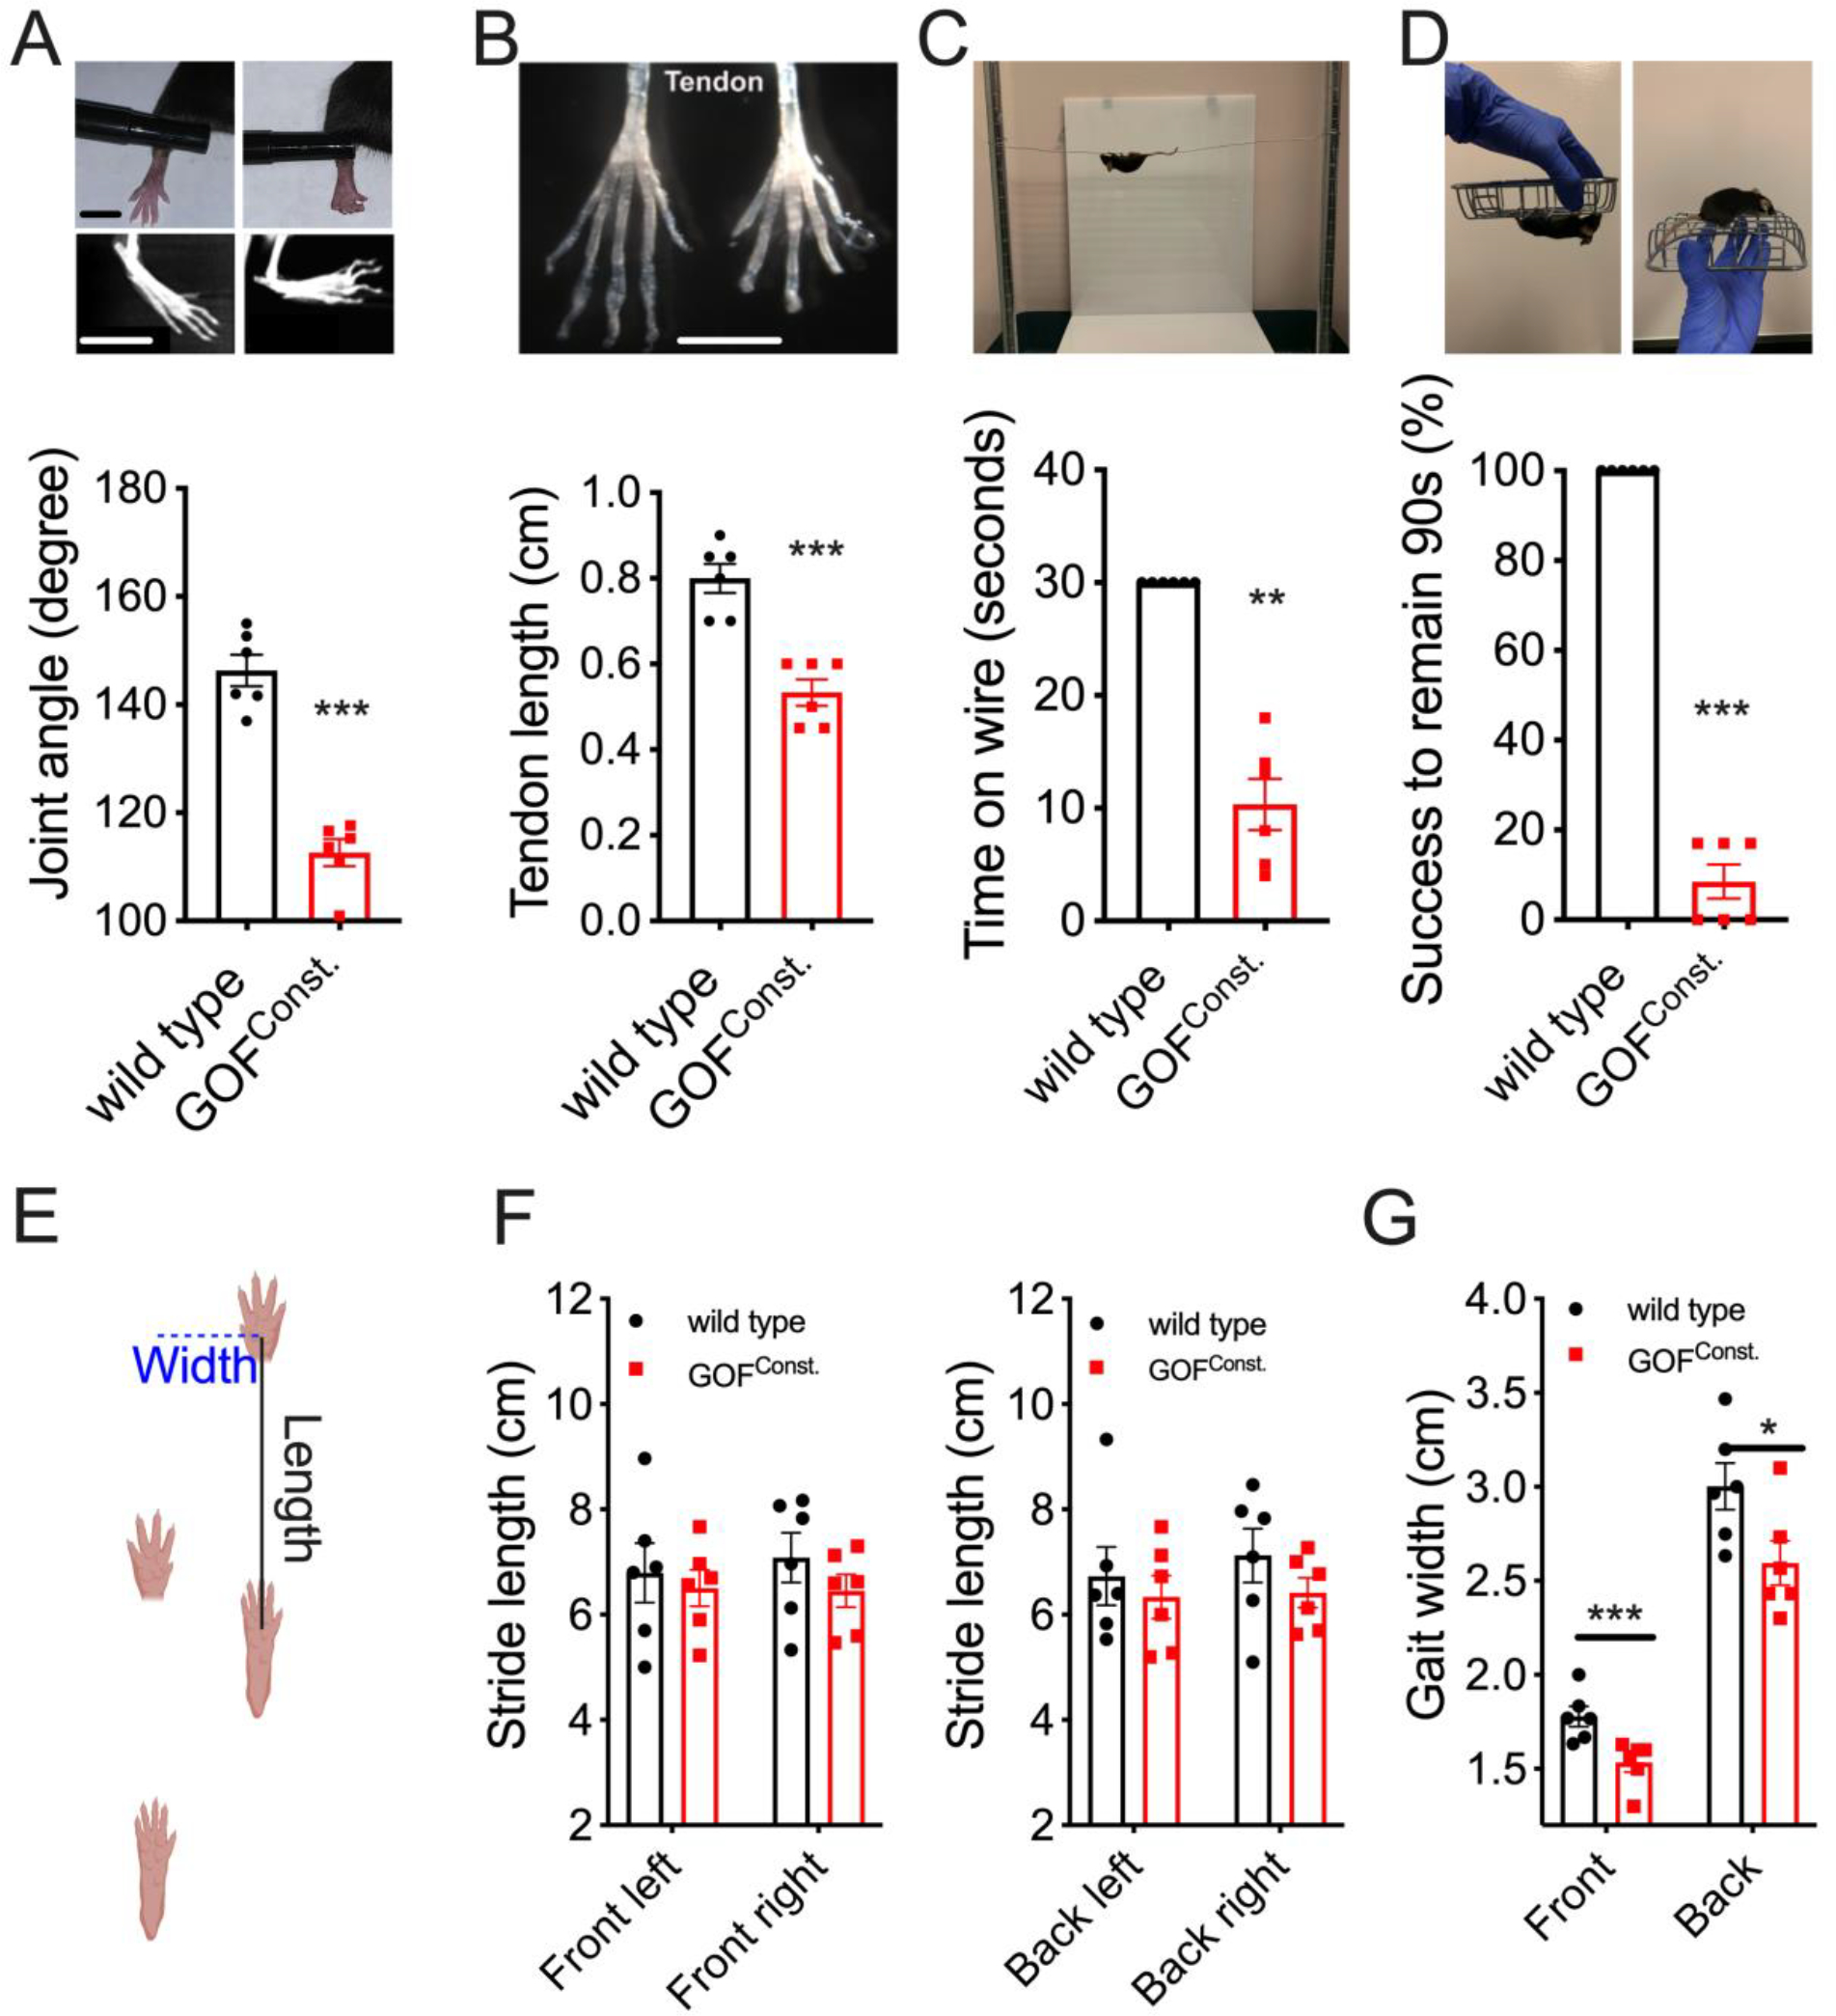
Figure 2. GOF Piezo2 mice develop limb defects.

(A) Joint morphology of live animals and CT scan (upper images) and phalange-metacarpal joint angles (lower graph) in the hindlimb. Left: wild type; Right: GOF mice. Scale bars: 0.5cm. (B) Intact tendon (upper) and tendon length (lower) from hindlimbs. Scale bar: 0.5cm. (C) Hanging wire test (upper) and Time (sec) that animals remained on the metal wire, with 30 sec as cutoff (lower). (D) Inverted screen test (upper) and quantification as percentage of animals successfully remaining on the rotating screen for 90 seconds (lower). (E) Gait assay: the stride length measures forelimb-hindlimb distance in the first (front) and second (back) stride. Gait width is the distance between forelimbs (front) or between hindlimbs (back) (F-G) Quantifications for E. *p < 0.05, **p < 0.01, and ***p < 0.001 (Student’s t-test). Each data point represents a single animal.
