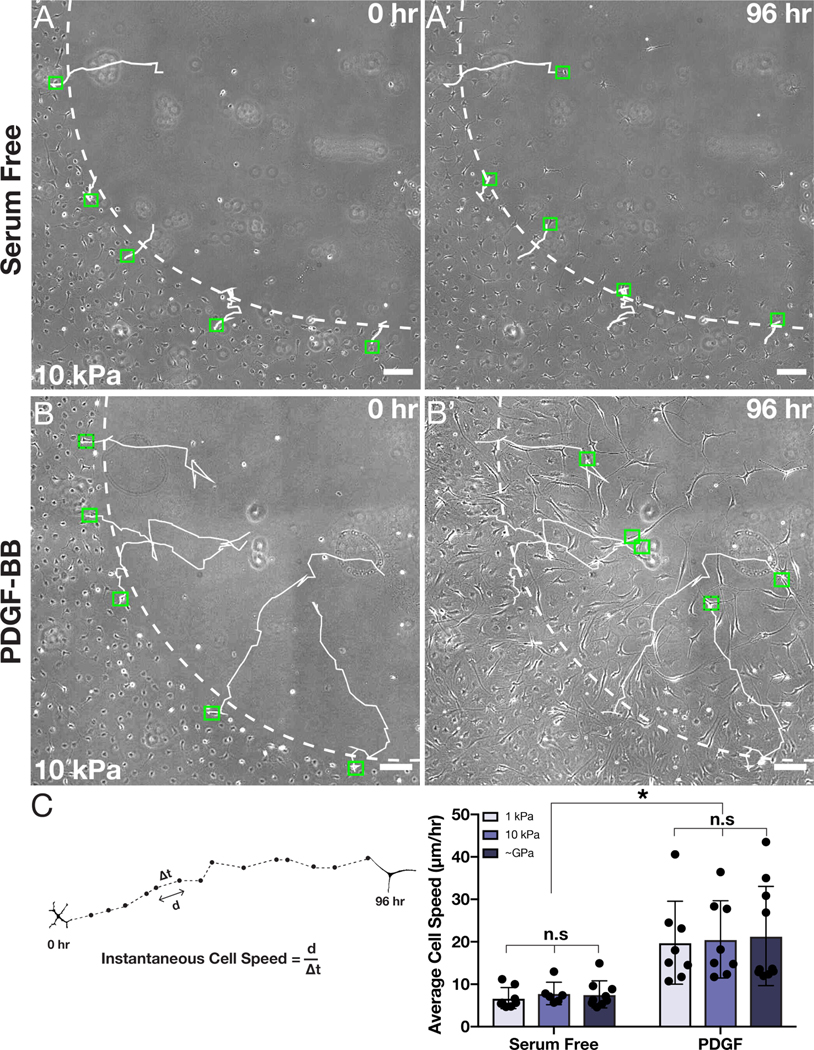
Fig. 6: Tracked motion of individual keratocytes is not modulated by substratum stiffness.
(A-B) Representative phase contrast images of cells migrating into a freeze injury in either (A) serum-free medium or (B) medium supplemented with PDGF-BB. Individual tracks are shown at either (A,B) 0 hr or at (A’,B’) 96 hr of culture. The dashed white lines indicate the initial wound border, the solid white lines indicate tracks of individual cells, and the green boxes designate the initial and final positions of each tracked cell. Scale bars, 100 μm. (C) Quantification of average cell speed during wound closure on substrata of different stiffnesses in either the presence or absence of PDGF-BB. Error bars represent mean ± s.d. for n = 10 substrates from 10 experimental replicates. A two-way ANOVA with a Tukey post-hoc test was used to evaluate significance among groups (*, p < 0.05; n.s., not significant).

