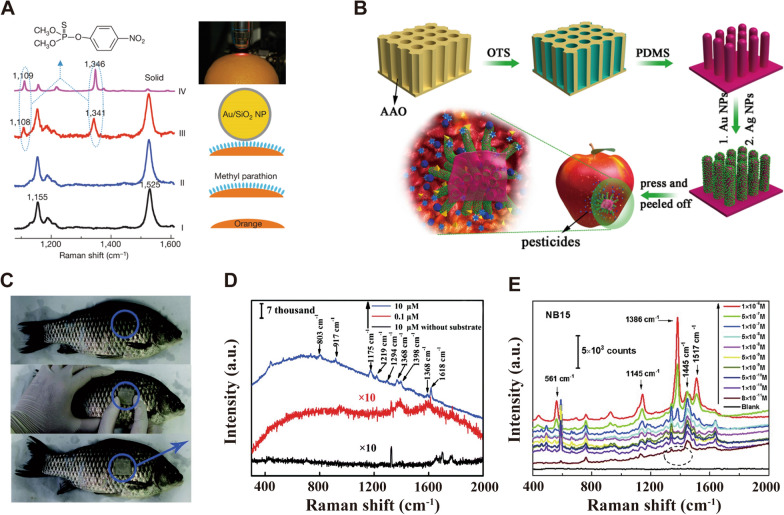
Fig. 11.
In-situ inspection of pesticide residues on food. A Schematic of the SERS experiment (right) and the corresponding Raman spectra on fresh citrus fruits (left). Spectrum I, with clean pericarps; spectrum II, contaminated by parathion. Spectrum III, spectrum of contaminated orange modified by Au/SiO2 nanoparticles. Spectrum IV, Raman spectrum of solid methyl parathion. [12] B Schematic demonstration of preparation of SERS substrate and SERS Measurement. [225] On-site detection of MG on C a living fish scale and corresponding D Raman spectra. [229] E The sensitivity to various concentrations of thriam based on Au@Ag nanocuboids. [231] A reprinted with permission from Ref. 12,
© 2021, Springer Nature. Figure B reprinted with permission from Ref. 225, © 2017, American Chemical Society. C and D reprinted with permission from Ref. 229, © 2018, Royal Society of Chemistry. E reprinted with permission from Ref. 231, © 2015, Royal Society of Chemistry

