Fig. 7.
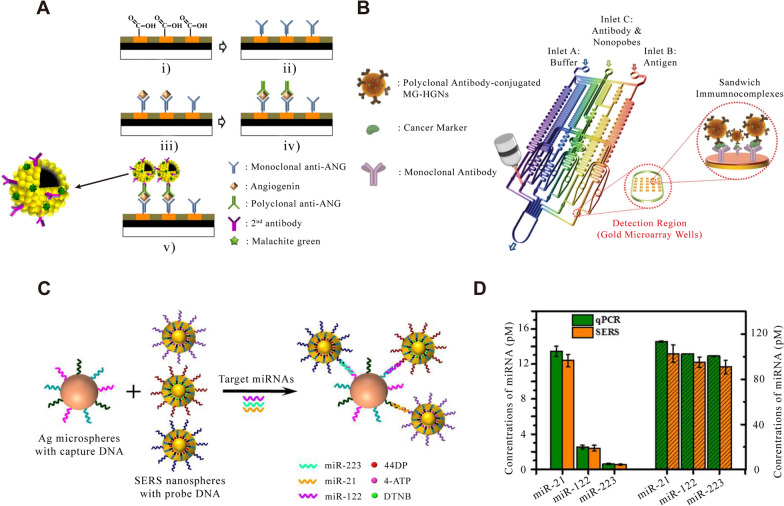
Tumor detection with cancer markers. A Schematics of sandwich immunocomplex formation for SERS imaging-based assay: (i) carboxylic acid modification, (ii) antibody immobilization, (iii) capturing of angiogenin antigens, (iv) polyclonal antibody immobilization, and (v) formation of HGN-binding immunocomplexes. [135] B Layout of a gold array-embedded gradient chip for the SERS-based immunoassay. The illustrations in the enlarged circles represent the formation of sandwich immunocomplexes on the surface of 5 × 5 round gold wells embedded in the gradient channel. [136] C Schematic Illustration of the Multiplex SERS assay for Triple-Target miRNA Detection. D Concentrations of miR-21, miR-122 and miR-223 in HepG2 samples measured by the proposed SERS sensor (orange column) and RT-PCR (green column). The left Y-axis represents the concentrations of singlet miRNA detection in cell sample. The right Y-axis represents the concentrations of multiplex miRNA detection in cell sample. Error bars show the standard deviation of three experiments. [143] A reprinted with permission from Ref. 135,
© 2011, Elsevier. B reprinted with permission from Ref. 136, © 2012, Royal Society of Chemistry. C and D reprinted with permission from Ref. 143, © 2017, American Chemical Society

